
Law 1–2: Anchor Your Stops to ATR(200) & √Time Exposures
- May 24, 2025
- Posted by: Drglenbrown1
- Category: Trading Methodology
In Laws 1 and 2 of Dr. Glen Brown’s Seven-Law framework, we establish the fundamental “volatility unit” and the √time scaling that turns ATR into a robust exposure count. This deep dive shows why ATR(200) reigns supreme and how √200≈15 exposures become the backbone of adaptive stops.
What Makes ATR(200) the Ultimate Exposure Unit
Average True Range (ATR) measures the average bar-to-bar trading range, including gaps. By choosing a long lookback—ATR(200)—we capture the full spectrum of volatility across our EMA zone (EMA 1→EMA 200). This ensures our stop buffer reflects not just recent chop but the broadest possible regime.
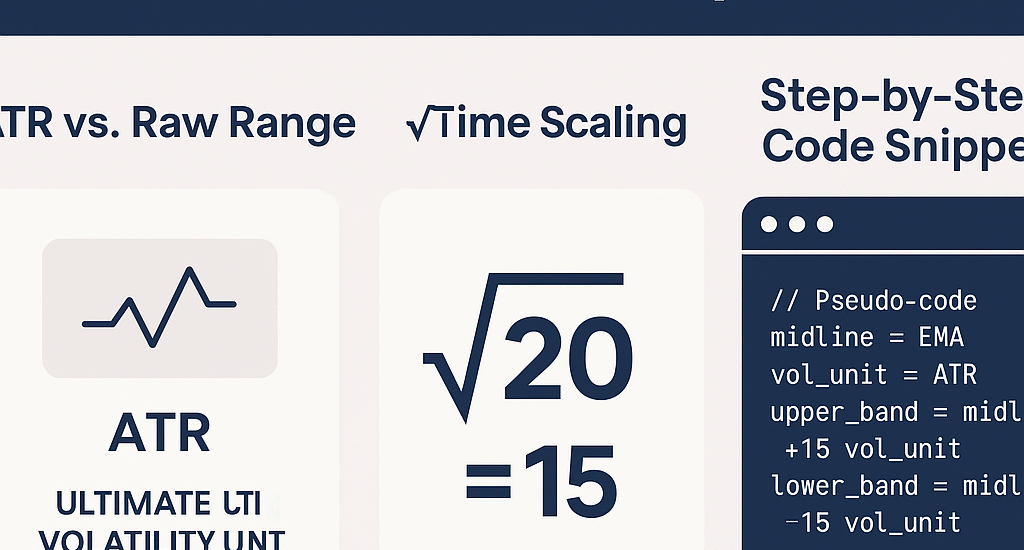
- Raw Range vs. ATR: Simple high–low ignores gaps and intra-bar moves; ATR aggregates True Range for a more complete volatility picture.
- Why 200 Bars? EMA(200) defines our structural market zone; ATR(200) matches it, anchoring our risk to the same timeframe.
The √Time Principle & Why √200 ≈ 15
Volatility scales with the square root of time. In Law 2, we set our exposure count k = √P, where P is the maximum EMA period (200):
k = √200 ≈ 14.14 → rounded to 15 exposures
Each “exposure” equals one ATR(200) unit. By using 15 of these, we cover deep corrective waves while staying true to the √time dynamics of price swings.
Step-by-Step: Compute & Visualize on Your Chart
1. Calculate ATR(200)
Use your platform’s ATR function with a 200-period lookback to plot volatility.
2. Compute √P Exposures
Take the square root of 200, then round to the nearest integer:
exposures = round(sqrt(200)) // → 153. Plot Your Volatility Units
Overlay bands at ±15×ATR(200) around your chart’s midline (e.g., EMA 200) to visualize the DAATS envelope.
Quick Implementation Snippet
// Pseudo-code for most trading platforms
midline = EMA(source, 200)
vol_unit = ATR(source, 200)
upper_band = midline + 15 * vol_unit
lower_band = midline - 15 * vol_unit

plot(midline, color='blue')
plot(upper_band, color='green')
plot(lower_band, color='red')
About the Author
Dr. Glen Brown, Ph.D. in Investments & Finance, is President & CEO of Global Accountancy Institute and Global Financial Engineering. With 25+ years pioneering proprietary trading and quantitative research, he created the GATS framework and this seven-law stop-loss architecture, uniting mathematical rigor with real-world applicability.
Business Model Clarification
Global Accountancy Institute and Global Financial Engineering operate exclusively as internal proprietary trading firms. We do not offer public courses or advisory services; all methodologies are for in-house research and professional desk development.
Risk Disclaimer
Trading derivatives and CFDs carries substantial risk and may not suit every investor. This article is educational only and does not constitute financial advice. Always perform your own due diligence and consult a licensed professional. Past performance does not guarantee future results; trade at your own risk.
Hashtags: #ATR #Volatility #StopLoss #SqrtTime #GATS #RiskManagement #TradingLaws #DrGlenBrown
Sponsored Content