
Keltner Reinvented: Embedding k = 15 into Your Trend Envelope
- May 25, 2025
- Posted by: Drglenbrown1
- Category: Trading Methodology
Traditional Keltner Channels use small ATR multipliers that often fail during extended trends or sudden volatility surges. By aligning your channel with Laws 1–3—using an EMA(200) midline and ±15×ATR(200) bands—you create a robust “trend tube” that defines valid higher highs/lows and automates trailing stops in one cohesive envelope.
Summary
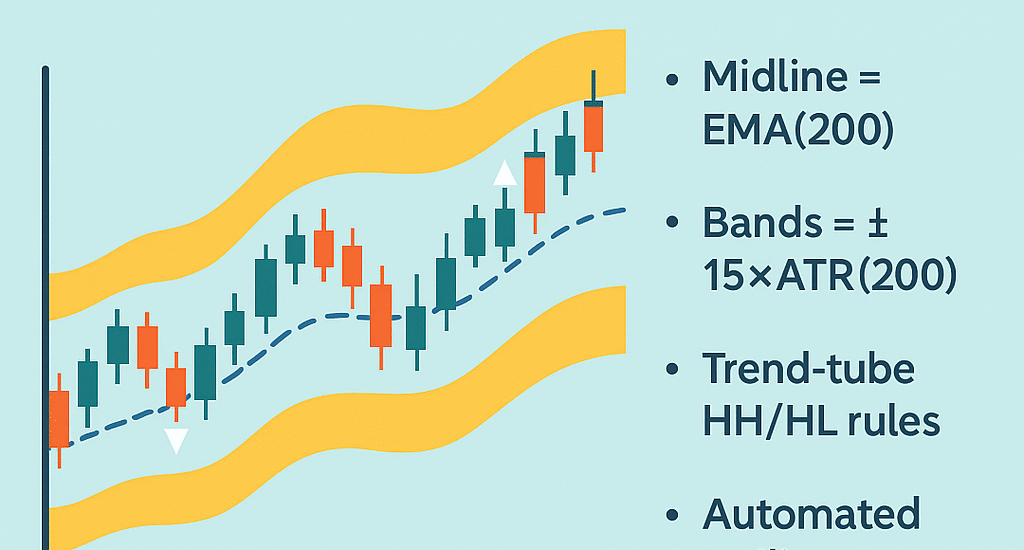
- Midline = EMA(200), bands = ± 15 × ATR(200)
- Trend-tube rules for higher high/higher low validation
- Automated trailing via dynamic channel updates
Key Sections
- Pine/MT4 Code Snippet
- Trend Failure & Acceleration Signals
- Chart Gallery Across Assets
1. Pine/MT4 Code Snippet
Below is an example in Pine Script for TradingView:
// Keltner Channel with k = √200 exposures
emaMid = ta.ema(close, 200)
atr200 = ta.atr(200)
k = math.round(math.sqrt(200))   // k = 15
upper = emaMid + k * atr200
lower = emaMid - k * atr200

plot(emaMid, color=color.blue)
plot(upper, color=color.green, style=plot.style_linebr)
plot(lower, color=color.red, style=plot.style_linebr)
Adapt similarly in MT4/5 using iMA and iATR functions.
2. Trend Failure & Acceleration Signals
- Trend Validity: All higher lows must remain above the lower band, and higher highs should occur within or above the upper band.
- Trend Failure: A close below the lower band signals a structural break—exit long positions.
- Trend Acceleration: A breakout above the upper band in strong momentum often marks the start of an extension phase—consider scaling in.
3. Chart Gallery Across Assets
Here are examples of the k=15 Keltner Channel applied to different instruments:
- Gold (XAU/USD) Daily chart
- EUR/USD 4H chart
- WTI Oil 1H chart
All show consistent trend-tube validation and automated trailing in action.

4. Entry, Re-Entry & Exit Rules
4.1 Entry Signals
- Pullback Entry: Wait for a dip that holds above the lower band (EMA(200)−15×ATR(200)), then enter long on a close back above the midline (EMA(200)).
Rationale: You’re buying in the lower 0.44 % tail of volatility (Chebyshev), with trend confirmed by the EMA. - Breakout Entry: If price has already cleared the upper band (EMA(200)+15×ATR(200)) in strong momentum, enter on a pullback that stays above the upper band.
Rationale: Captures trend‐extension moves—only accelerate when price returns from a new alligator swing high.
4.2 Re-Entry / Scaling-In
- Midline Retest: After a first‐leg move above upper band, you can scale in on a shallow pullback to EMA(200) or into the channel’s midpoint buffer (≈ EMA + 7–8×ATR).
Rule of Thumb: Only re-enter if price stays above the previous swing low and the lower band. - Band‐Bounce: On a second clear touch of the upper band—without closing below midline—you may add to your position, keeping each lot’s stop at its own lower‐band level.
4.3 Exit Rules
- Trend Break Exit: Close the full position if price closes below the lower band. This indicates a structural trend failure beyond the 99.56 % noise tube.
- Midline Exit (Optional): In choppy or sideway regimes (flat channel), you can exit half your size when price closes below EMA(200), preserving capital for clearer setups.
- Time‐Stop: If no meaningful band‐touch or trend extension occurs within 2–3×ATR(200) worth of bars, manually exit to avoid low‐probability drift.
4.4 Example Workflow
- Plot EMA(200) & ±15×ATR(200) bands.
- Wait for a pullback above the lower band.
- Enter when price closes back above EMA(200).
- Shift stop to breakeven when price gains ≥ L×ATR(200) (per Laws 4–5).
- Scale in further on midline or upper-band retests (per 4.2).
- Exit fully on a close below the lower band.
This sequence ensures you’re always trading within the 15×ATR “trend tube,” only entering into confirmed structure, locking in profits at breakeven, and exiting on true structural breaks.
About the Author
Dr. Glen Brown, Ph.D. in Investments & Finance, is President & CEO of Global Accountancy Institute and Global Financial Engineering. With over 25 years of proprietary trading and quantitative research experience, he created the GATS framework and this adaptive Keltner Channel approach.
Business Model Clarification
Global Accountancy Institute and Global Financial Engineering operate exclusively as internal proprietary trading firms. We do not offer public courses or advisory services; our methodologies guide in-house research and desk development.
Risk Disclaimer
Trading derivatives and CFDs entails substantial risk and may not suit all investors. This article is educational only and not financial advice. Always conduct your own due diligence and consult a licensed professional. Past performance is no guarantee of future results; trade at your own risk.
Hashtags: #KeltnerChannel #ATR #EMA #TrendTube #TradingStrategies #GATS #DrGlenBrown
Sponsored Content