
EZIM Demand–Supply Projections (M1440)
- September 28, 2025
- Posted by: Drglenbrown1
- Category: GATS / EZIM
Re-Entry, Confirmation, Corridor Width, Compression & Energy — with MACD (15,25,8) governance and ATR-aware execution.
1) Model Context
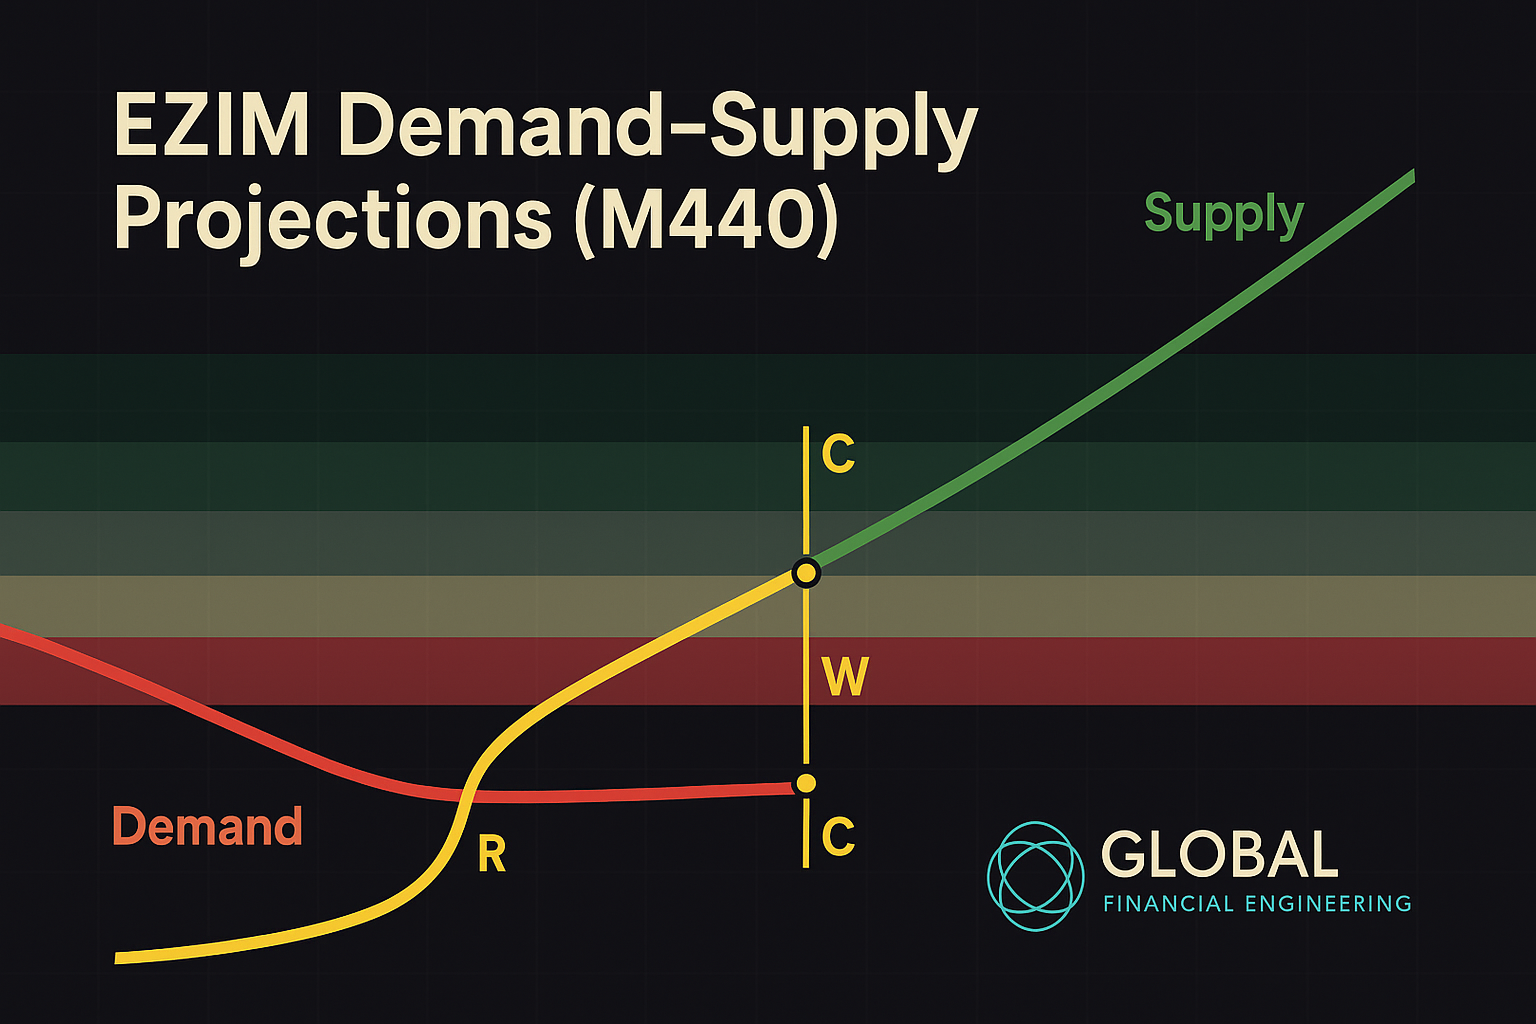
EZIM (EMA Zones Interactions Model) extends our color-coded EMA zones by focusing on how price interacts with structure. Here, we pair the EZIM lens with classical demand and supply lines on the M1440 (Daily) timeframe, tracked with a Yellow Price Line (YPL).
- Demand line: downward sloping (buyers supporting at progressively lower levels).
- Supply line: upward sloping (sellers offering at progressively higher levels).
- YPL: current price guide for structural interaction.
When price trades below both lines, we define two vertical projections: Re-Entry (to Demand) and Confirmation (to Supply). Their difference is the Uncertainty Corridor (Gap), which we normalize by ATR to quantify compression and stored energy.
2) Notation & Setup (M1440)
- Daily index:
t = 0,1,2,...with current bart0. - Close price:
Pt. - Demand (downward):
Dt = αD + βD·t, withβD < 0. - Supply (upward):
St = αS + βS·t, withβS > 0. - Assume the current state:
Pt0 < Dt0andPt0 < St0.
Fit each line from your chosen swing anchors (2+ pivots, OLS/regression).
3) Vertical Projections at the Current Bar
Re-Entry (to Demand):
Rt0 = Dt0 = αD + βD·t0Confirmation (to Supply):
Ct0 = St0 = αS + βS·t0Uncertainty Corridor (Gap):
Wt0 = Ct0 − Rt0 = St0 − Dt0Interpretation:
• Crossing Re-Entry means buyers have re-admitted price into the battlefield.
• Crossing Confirmation with buffer validates a bullish regime shift (sellers overwhelmed).
4) Apex, Compression & Energy
Intersection (Apex) time of demand and supply lines:
t* = (αD − αS) / (βS − βD)
Days-to-Apex: Δ* = t* − t0
ATR-normalized compression (use Daily ATR period n, e.g., 50):
CRt = Wt / ATRtEnergy score (inverse compression):
Et = 1 / (CRt + ε), with ε ≈ 1e−6Smaller CR and shrinking Δ* imply stronger squeeze and higher stored energy for a decisive move.
5) Momentum Governor (Daily MACD 15,25,8)
- MACD line:
Mt = EMA15(P)t − EMA25(P)t - Signal:
Sgt = EMA8(M)t - Histogram:
Ht = Mt − Sgt
Bias rules: Ht0 > 0 and rising → bullish impulse strengthening. Ht0 < 0 and falling → bearish impulse strengthening.
6) EZIM State Logic (below both lines)
- Stage A — Submerged (Bear Control):
Close < Dt. Avoid longs unless strong reversal confluence (divergence + ultra-tightCR). - Stage B — Re-Entry (Neutral/Compression):
Close ≥ Dt + k1·ATRt, withk1 ∈ [0.10, 0.30]. - Stage C — Confirmation (Bullish Regime Shift):
Close ≥ St + k2·ATRt, withk2 ∈ [0.20, 0.50].
Adaptive buffers: tighten k1, k2 when CR is very small (high compression), and widen when CR is large (choppy battlefield).
7) Probabilistic Breakout Score (Logistic)
Standardized inputs (clip to stable ranges):
z1 = clip( (Close − Dt) / ATRt, −3, 3 )— distance above Demand (ATR-scaled)z2 = clip( (Close − St) / ATRt, −3, 3 )— distance vs Supplyz3 = clip( Ht / std(H), −3, 3 )— MACD hist standardizedz4 = clip( 1 / (CRt + ε), 0, 10 )— energy
Score:
Πt = sigmoid( w0 + w1·z1 + w2·z2 + w3·z3 + w4·z4 )Starter weights: w0=−0.5, w1=0.8, w2=1.0, w3=0.6, w4=0.4 (calibrate on your book).
Reading: Π ≥ 0.70 = high-quality bullish resolution; 0.55 ≤ Π < 0.70 = constructive; otherwise stand down.
8) Execution: Entries, DS/BE & Profit Banking
- Entry: Stage C close + retest of broken Supply as support; or scale 50/50 (close + retest).
- Stops: System DS (e.g.,
12×or16×ATR-50). Optional structural stop:1.0–1.5×ATR below reclaimed line. - Break-Even: If DS=
16×ATR, BE ≈ 6.25% of DS. Corridor-aware BE:max(0.5·Wt, 1.0·ATRt)after a clean retest hold. - Profit Banking: Use GATS structural wells (x3/x6/x9) for staged profit while a core rides under DAATS.
9) Recommended Defaults
| Parameter | Default | Notes |
|---|---|---|
| ATR Period | 50 | Aligns with your current baselines. |
| MACD | 15, 25, 8 | Daily governor. |
| k1 (Re-Entry buffer) | 0.20 × ATR | Adaptive 0.10–0.30 via CR. |
| k2 (Confirmation buffer) | 0.30 × ATR | Adaptive 0.20–0.50 via CR. |
| Weights (w0..4) | −0.5, 0.8, 1.0, 0.6, 0.4 | Calibrate empirically. |
| DS (system) | 12×–16× ATR-50 | DAATS auto-adapts expansion/compression. |
| BE (fractional) | ≈ 6.25% of DS | If DS = 16× ATR. |
10) Diagram (Inline SVG): Vertical Projections & Corridor
Supply St Demand Dt t₀ Yellow Price (Pt₀) R = Dt₀ (Re-Entry) C = St₀ (Confirmation) Gap W = C − R Yellow Price Demand (down) Supply (up) At t₀, vertical projections define R (Re-Entry) and C (Confirmation). Their difference W is the corridor.
11) Coding Hooks (GATS-Ready)
// Inputs: OHLC daily, current index t0
// Fit lines: D_t = αD + βD*t (βD<0); S_t = αS + βS*t (βS>0)

// Projections:
R = D[t0];
C = S[t0];
W = C - R;

ATR = ATR50[t0];
CR = W / ATR;
Energy = 1.0 / (CR + 1e-6);

// MACD (15,25,8): M, Sg, H; also deltaH if needed

// Stage flags:
stageA = (Close < D[t0]);
stageB = (Close >= D[t0] + k1*ATR) && (Close < S[t0] + k2*ATR);
stageC = (Close >= S[t0] + k2*ATR);

// Probability score Π:
z1 = clip((Close - D[t0]) / ATR, -3, 3);
z2 = clip((Close - S[t0]) / ATR, -3, 3);
z3 = clip(H / rollingStd(H, L), -3, 3);
z4 = clip(1.0 / (CR + 1e-6), 0, 10);

Pi = sigmoid(w0 + w1*z1 + w2*z2 + w3*z3 + w4*z4);

// Actions:
if (stageC && Pi >= 0.70) {
  // enter long on close or retest of C
  // DS: 12x–16x ATR50 (system); optional structural stop ~1.0–1.5x ATR below reclaimed line
  // BE: 6.25% of DS (if DS=16x ATR) or max(0.5*W, 1.0*ATR) post clean retest
} else if (stageB && Pi >= 0.55 && deltaH > 0) {
  // watchlist or partial probe with tight structure
} else {
  // no long
}
About the Author
Dr. Glen Brown is President & CEO of Global Accountancy Institute, Inc. and Global Financial Engineering, Inc., the architect of GATS, EZIM, and the Nine-Laws Volatility Framework.
General Disclaimer
This material is for educational purposes only and does not constitute financial advice or a solicitation to buy or sell any instrument. Trading involves substantial risk. Past performance is not indicative of future results. You are solely responsible for your decisions.