
Whiskers & Fences: A Boxplot Approach to Adaptive Volatility Stop-Loss
- May 26, 2025
- Posted by: Drglenbrown1
- Category: Trading Methodology
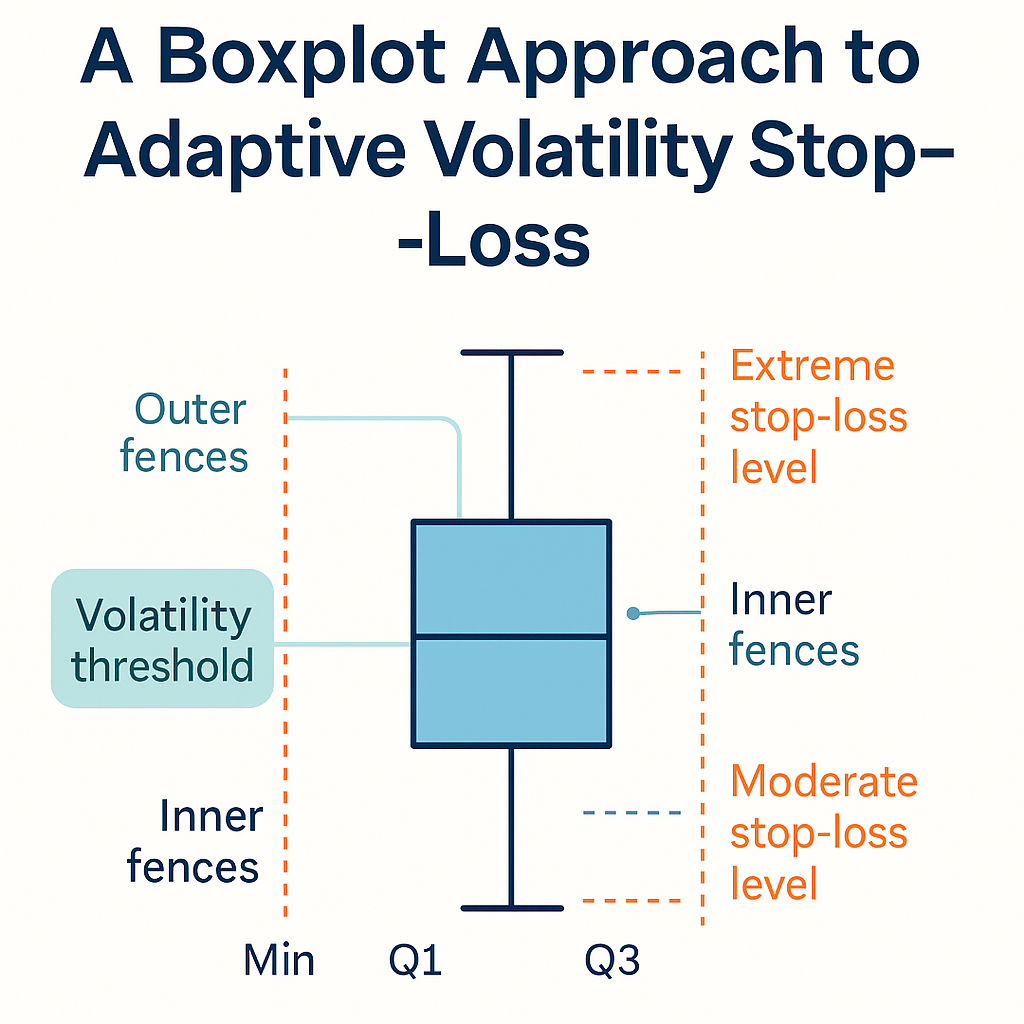
Beyond simple ATR-multiples, we can borrow from Tukey’s boxplot to build statistical “fences” around our ATR(200) exposures—hinges (Q₁, Q₃), inner fences (±1.5 × IQR), and outer fences (±3 × IQR)—to detect volatility regime shifts and adapt our Breakeven & Trailing rules within Dr. Glen Brown’s Seven-Law framework.
Why Boxplot Fences?
Standard stops assume a fixed multiplier. By contrast, boxplot fences let us:
- Detect regime shifts: exposures crossing inner fences flag noise extremes.
- Scale buffers: lean or deepen your L exposures based on Q₁/Q₃ and IQR.
- Cap runaway stops: outer fences impose a maximum DAATS limit.
Key Concepts & Definitions
| Boxplot Element | Statistical Definition | GATS Mapping |
|---|---|---|
| Lower Hinge (Q₁) | 25th percentile | Conservative Breakeven L = Q₁ |
| Upper Hinge (Q₃) | 75th percentile | Deep-buffer Breakeven L = Q₃ |
| IQR | Q₃–Q₁ | Exposure spread for interpolation |
| Inner Fences | Q₁–1.5×IQR, Q₃+1.5×IQR | “Routine” noise extremes—adjust L |
| Outer Fences | Q₁–3×IQR, Q₃+3×IQR | True outliers—cap stops / pause entries |
Computing Hinges & Fences
// Calculate rolling ATR(200) exposures
exposures = rolling_atr200_exposures

Q1 = percentile(exposures, 25)
Q3 = percentile(exposures, 75)
IQR = Q3 – Q1

inner_lower = Q1 – 1.5 * IQR
inner_upper = Q3 + 1.5 * IQR

outer_lower = Q1 – 3   * IQR
outer_upper = Q3 + 3   * IQR
Applying Fences to Your Stop-Loss Laws
- Dynamic L Selection (Laws 4–5):
- If exposures ≤ inner_upper → use L between Q₁ and median (Q₂).
- If inner_upper< exposures ≤ outer_upper → use L = Q₃.
- If exposures > outer_upper → enter “extreme volatility” mode: widen stops to full DAATS or halt new entries.
- Regime Alerts:
- Whisker-Cross Alert when exposures cross inner fences.
- Outlier Alarm when exposures exceed outer fences—tighten all stops immediately.
- Adaptive Stop Caps: Limit your DAATS envelope so it never grows beyond
outer_upper × ATR(200), even if ATR spikes.
Example Workflow
- Compute rolling exposures and boxplot statistics over a 200-bar window.
- Calculate inner/outer fences.
- On each new bar, pick L based on current exposure vs. fences.
- Apply L in Breakeven & Trailing formulas:
BE = Entry + L×ATR(200); Trail = HighSinceBE – L×ATR(200) - Cap maximum stop distance at
outer_upper×ATR(200).
About the Author
Dr. Glen Brown, Ph.D. in Investments & Finance, leads Global Accountancy Institute (GAI) and Global Financial Engineering (GFE). With over 25 years in quant research and proprietary trading, he pioneered the GATS framework and these statistical-fence stop-loss enhancements.
Business Model Clarification
GAI & GFE are strictly internal proprietary trading firms. We do not offer public courses or advisory services; all methodologies serve in-house desk development.
Risk Disclaimer
Trading CFDs and derivatives involves significant risk. This article is educational only and not financial advice. Always conduct your own due diligence and consult a licensed professional. Past performance does not guarantee future results; trade responsibly.
Hashtags: #Boxplot #Whiskers #Fences #ATR #StopLoss #Volatility #GATS #RiskManagement #DrGlenBrown
Sponsored Content