The Machine Readings · Paper II
A sub-series of the Public Doctrine Series
The Occupied Book
A fair walk is fair in money but not in time or in capacity: why the open book is made largely of the positions that will fail, and why edge must be priced by the day
Dr. Glen Brown · President & CEO, Global Financial Engineering, Inc. and Global Accountancy Institute, Inc.
GFE-PUB-MR-20261026-B-CS · 26 October 2026
How to read this paper. The Machine Readings reason from a trading machine’s own records rather than from commentary on markets. Every claim of fact carries one of three marks. [W] Witnessed: read directly from a ledger or journal the machine wrote. [D] Derived: computed from witnessed figures, or from stated mathematics, by a method this paper gives. [I] Inferred: an interpretation the evidence supports but does not compel. A sentence without a mark is argument, not evidence.
About the case. The case in this paper is an illustration built from operating data. Figures have been altered so that no account, venue or period can be identified, and nothing here reports the results of any account. The mathematics, the design and the reasoning are unaltered.
I. The Reading
The first paper in this series, The Seven-Day Horizon, followed a single position through its life and found that success and failure keep different clocks: a position with a near bank and a far stop banks in hours and dies in weeks. This paper stops the clock and looks at the whole book in one instant, and finds that the asymmetry of time becomes an asymmetry of composition. The book a manager sees on any given evening is not a portrait of the positions the machine opens. It is a portrait of the positions that stay.
At the close of the reading the book held about 120 open positions. Measured by how far each had travelled toward its stop, they carried a combined chance of death of 30 per cent, against 4.8 per cent on the day each was born, and the edge instrument projected about 40 deaths among them. [W] Read naively, that is a book in difficulty: a machine that dies at roughly one birth in twenty appears to be holding a book in which nearly one position in three is condemned.
The reading of this paper is that the naive view has the benchmark wrong. A book that is merely fair, that earns nothing and loses nothing beyond its costs, must carry roughly three tenths of its open positions as future deaths, because the positions that will bank leave almost as soon as they arrive and the positions that will die stay. The right comparison for an open book’s death chance is not the death rate of births. It is the share that a fair walk would leave resident in the book, and that share can be calculated.
The same asymmetry runs through the book’s use of its capacity and its payment of carry. Over the fortnight of the reading, 64 per cent of the positions that closed banked within a day of birth, and together they occupied 8.1 per cent of the capacity-days the closed positions consumed. [W] The deaths and the slow banks, a tenth of the closes, paid three quarters of the carry. [W] What a book earns per trade and what it earns per day of the capacity it occupies are different quantities, and under a commitment ceiling it is the second that governs.
II. The Mechanism
The Fair Walk Triad
The Seven-Day Horizon defined a fair walk as a price whose expected future value equals its present value, judged against a position carrying a fixed bank and a fixed stop. This paper asks in what currencies such a walk can be fair, and answers: in three, of which it is fair only in the first.
Table 1. The Fair Walk Triad
| Currency | What a fair walk does | Measure | Value on the fastest lane |
|---|---|---|---|
| Money | Fair: no exit geometry creates or destroys expectancy | Death probability = b ÷ (b + D) = break-even death share | 3.90% |
| Time | Unfair: banks arrive in hours, deaths in weeks | Fair-Walk Duration Ratio = mean time to death ÷ mean time to bank | about 10 (medians about 60) |
| Occupancy | Unfair: the open book holds the positions that stay | Occupancy Share = share of open positions destined to die | about 30% |
Derived. Fastest-lane geometry: bank 0.203 and stop 5.00 daily ranges; daily dispersion calibrated at 0.8 to 1.0 daily ranges as in Paper I; continuous-time death probability 3.90 per cent.
Fair in money. On a fair walk no rule for when to exit can turn a zero expectation into a positive one. This is Doob’s optional stopping theorem, and Kaminski and Lo (2014) drew its consequence for stop-loss rules: under a random walk a stop can only lower expected return, and earns its keep only when returns carry momentum. For a position with its bank at b and its stop at D, the probability of death is b ÷ (b + D), which is also the death share at which the geometry breaks even. [D] Paper I called this identity the null hypothesis written into the order book.
Fair in time. Conditioned on banking, a fair-walk position leaves on a timescale set by the square of the bank’s distance; conditioned on dying, on a timescale set by the square of the stop’s. On the fastest lane the mean time to bank is 1.3 to 1.9 days and the mean time to die 13 to 20 days, a ratio of about ten; the medians differ by a factor of about sixty, because most banks are very fast and a few are slow. [D] I call the ratio of the means the Fair-Walk Duration Ratio. It is the length of time a purely mechanical rule, with no judgement in it at all, will hold its losers relative to its winners.
Fair in occupancy. Now take the book at an instant. Little’s law, the identity of queueing theory that equates the number of items in a system with the rate at which they arrive multiplied by the time each stays, applies to each class of outcome separately. If births arrive at a steady rate and a fraction p of them die, the share of the open book made up of future deaths is p × W_death ÷ [p × W_death + (1 − p) × W_bank], where W is the mean time each class stays. [D] This is the inspection paradox of renewal theory, the reason a passenger arriving at a random moment waits longer than the average gap between buses, applied to a trading book. With p = 3.90 per cent and the times above, the Occupancy Share is 29 to 30 per cent. [D] A book in which one birth in twenty-six dies holds, in steady state, about one future death in every three or four open positions, and it does so while earning exactly nothing.
What is inherited, and what is new
The parts of this argument are not new, and it would be a poor reading that pretended otherwise. Optional stopping is Doob’s; the inspection paradox is Feller’s textbook material; Little’s law dates from 1961; the treatment of stop-loss rules under a random walk is Kaminski and Lo’s; the classification of outcomes by whichever barrier is touched first is the triple-barrier method that López de Prado brought into financial machine learning. What I have not found, in a search of the published literature that I report as a search and not as a proof of absence, is any of three uses to which this paper puts them: the Occupancy Share as the null against which an open book’s condition is read; the Occupancy Yield, below, as the measure of edge for a book bound by a capacity ceiling; and the Fair-Walk Duration Ratio as the mechanical baseline that studies of how long traders hold their losers have so far lacked. To our knowledge, those three are this paper’s contribution.
III. The Argument
First proposition: the open book is not a sample of the births
An open book is a length-biased sample. Every position enters it at birth, but each stays for as long as its outcome takes to arrive, and the outcomes that take longest are overrepresented in proportion to their stay. On a near-bank, far-stop geometry those outcomes are the deaths and the slow banks. The book’s condition must therefore be read against the Occupancy Share, not against the death rate of births. [I]
Applied to the book, the reading is less alarming than it first appears. The open book’s death chance of 30 per cent stands within a point or two of the steady-state Occupancy Share. [W][D] A sharper null uses the book’s own calendar: taking each of the 388 births made under the present exit law at the moment it was actually born, and asking a fair walk how many would still be open at the close of the reading and how many of those would be destined to die, gives an Occupancy Share of roughly a quarter to three tenths. [D] One caution keeps this from being a verdict. The book still holds positions born before the present exit law, under a different geometry, and the comparison will be clean only when those have resolved. [I]
Second proposition: the duration disparity is mechanical before it is psychological
A long and distinguished literature, from Shefrin and Statman’s description of the disposition to sell winners too early and ride losers too long (1985) to Odean’s measurement of it in brokerage accounts (1998), treats the longer holding of losing positions as a behavioural fact. A recent study of individual currency traders measured the gap in holding time directly and attributed it to loss aversion and its relatives (Ivantchev, 2025). None of these studies, so far as I can find, subtracts what the geometry of a trader’s own stops and targets would produce if the trader had no psychology at all.
The book in the case supplies the control, because it has no psychology and no discretion. Over the fortnight of the reading its 305 banks lived a median of about fourteen hours and a mean of 1.9 days; its 18 deaths lived a median of 12.6 days and a mean of 13.9 days. [W] It held its losers 7.3 times as long as its winners on average, and about twenty times as long at the median. [D] A fair walk on its geometry predicts a ratio of about ten on average. [D] A machine that cannot be loss-averse displays the disposition effect’s signature in full. The inference for the behavioural literature is narrow but firm: an observed disparity in holding time is evidence of psychology only to the extent that it exceeds the Fair-Walk Duration Ratio of the trader’s own exit geometry. [I]
Third proposition: edge must be priced per day of capacity occupied
A book bound by a commitment ceiling cannot open a position without capacity to carry its risk, and capacity is returned only when a position closes. The scarce resource is therefore not trades but capacity-days: one unit of risk held for one day. I call the realised return per capacity-day the Occupancy Yield, and it ranks the book’s outcomes very differently from the return per trade. [I]
Table 2. Occupancy Yield by outcome: positions closed during the reading
| Outcome | Closes | Realised R | Capacity-days (R × days) | Occupancy Yield (R per capacity-day) | Carry paid ($) |
|---|---|---|---|---|---|
| Banks within a day | 207 | +9.6 | 64 | 0.15 | 0.95 |
| Banks in 1–7 days | 80 | +3.9 | 246 | 0.016 | 3.30 |
| Banks after 7 days | 18 | +0.7 | 241 | 0.003 | 6.70 |
| Deaths | 18 | −18.0 | 240 | −0.075 | 6.60 |
Witnessed closes, realised net of carry and commission; capacity-days counted as one unit of risk per position for each day it was open; Occupancy Yield derived. Figures altered for the case.
The table carries the whole of the third proposition. A bank that arrives within a day earned 0.15 R for every day of capacity it held; a bank of the same kind that took more than a week earned 0.003, some fifty times less, because carry and time consumed nearly all of it. [D] The banks as a class earned 0.026 R per capacity-day; the book as a whole, deaths included, earned −0.005. [D] The quick banks, 64 per cent of the closes, used only 8.1 per cent of the capacity-days. [W] Two rules with identical expectancy per trade can therefore differ greatly in value to a capacity-bound book, and the difference lies wholly in how long their slow banks and their losers stay. That is the channel through which a rule that banks faster, of the kind Paper I examined, creates value even before its death rate is known. [I]
Figure 1. Where the book’s closes, capacity and carry went
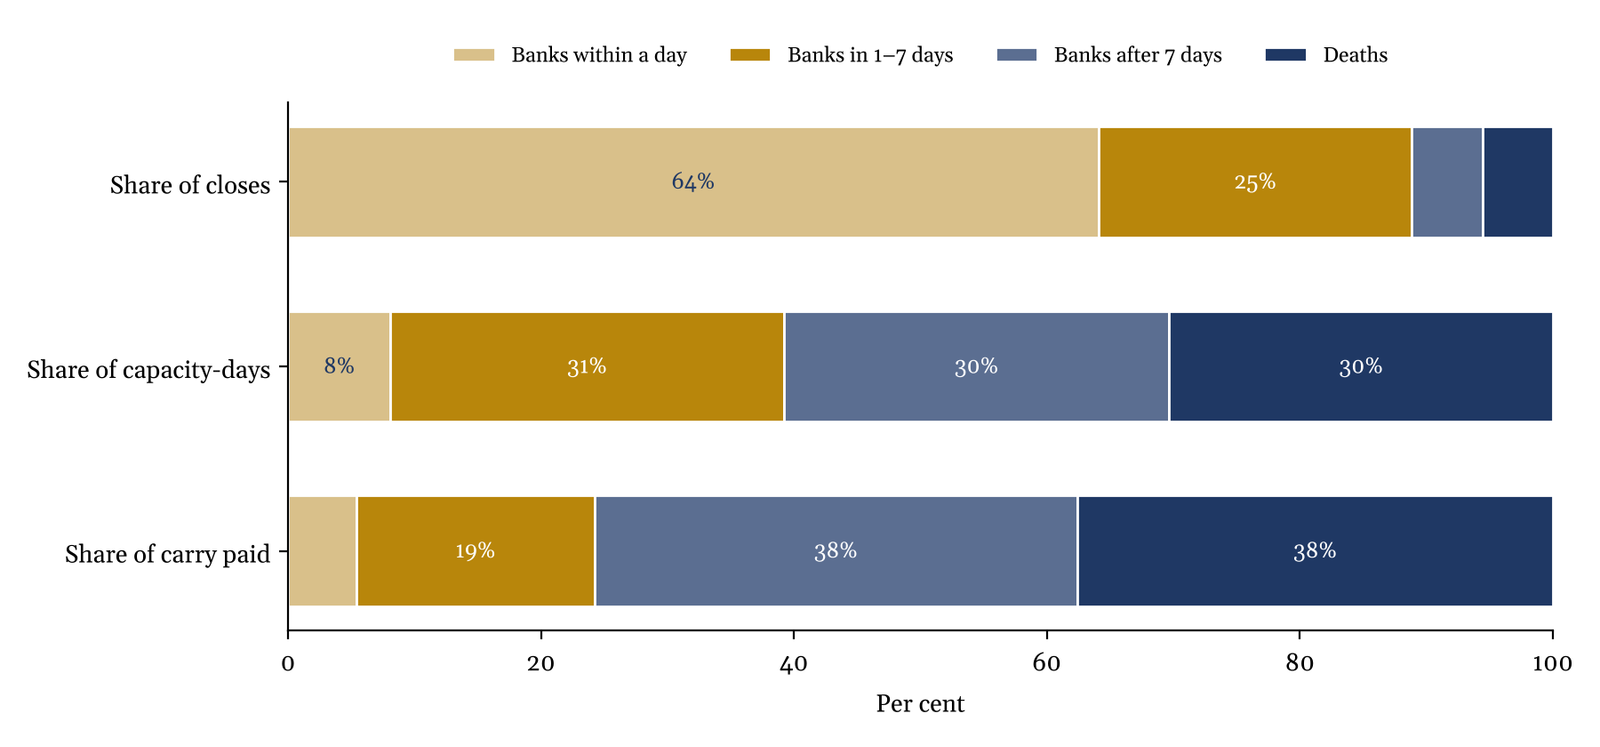
Witnessed. Positions closed during the reading, by outcome: their share of the number of closes, of the capacity-days the closed positions occupied, and of the carry they paid. Figures altered for the case.
Fourth proposition: carry falls where occupancy falls
Carry is charged by the night, so it falls on positions in proportion to the nights they spend in the book. The deaths, 18 of the closes, paid 37.6 per cent of the carry the closed positions paid; the slow banks paid as much again. [W] Per position, a death carried about ten times the swap of a bank. [D] A test that admits a position only if its bank can cover a stated number of nights of carry prices the nights of the outcome that leaves quickly. Under a fair walk the outcome that pays most of the carry stays two to three weeks on average. [D] Whether an admission test should also price the occupancy of the death it admits is a question the case raises and does not settle. [I]
Fifth proposition: the book walks slower than fair
The calendar null gives one more reading, and it is not flattering. A fair walk, given the 388 births under the present exit law at the moments they were made, would by the close of the reading have produced 315 to 330 banks and left 58 to 74 positions open. The book produced 286 banks and left 91 open. [W][D] It banks less often and holds more than a fair walk of the calibrated dispersion would, and its occupancy is correspondingly heavier. Two explanations compete. The first is a measurement one: the model lets price diffuse through every hour of every trading day, while single equities, a large part of the book, move only in their sessions and gap between them, so the model’s clock runs faster than the book’s. The second is substantive: some of the book’s markets are less favourable to a near bank than the calibration assumes. [I] The two can be separated by re-running the null on each instrument’s own session clock, and the next reading will do so.
A book is judged by what it earns per day of capacity it occupies, and its open inventory is judged against the share a fair walk would leave there.
IV. What Would Falsify This Reading
The Occupancy Share. On a book whose exit geometry has been stable long enough to approach a steady state, the open book’s share of positions that go on to die should approach p × W_death ÷ [p × W_death + (1 − p) × W_bank] computed from that book’s own realised death share and mean stays. If, with the legacy positions resolved, the realised share of the open book that dies differs from that prediction by more than its sampling error, the occupancy law as applied here fails. [I]
The duration baseline. If a mechanical book with a near bank and a far stop were found to hold its losers for no longer than its winners, or if the ratio it displays bore no relation to its geometry, the second proposition would fail. The book in this paper displays a ratio of the predicted order; a single book is not a population, and the claim stands to be tested on others. [I]
The Occupancy Yield. The third proposition predicts that, reading after reading, quick banks earn more per capacity-day than slow banks by a wide margin. If the ranking reverses, or the margin collapses once carry is netted out, the case for pricing edge per capacity-day weakens. [I]
The slower walk. If, on each instrument’s session clock, the calendar null matches the book’s banks and open count, the fifth proposition was a measurement artefact and is withdrawn. If it does not, the book’s markets are slower to bank than the calibration allows, and that becomes the subject of its own reading. [I]
V. The Case
The case is a small multi-asset book operated by a governed portfolio controller under the exit geometry described in Section II, read over a fortnight from its own ledgers and journals, and at the close of that fortnight. Capacity-days are counted from birth, so a position born before the window and closed within it is counted for its whole life. [W]
Table 3. The open book at the close of the reading
| Cohort | Open positions | Median age (days) | Exit law at birth |
|---|---|---|---|
| Earlier exit regime | 33 | 22 | different geometry |
| Reference cohort | 25 | 10 | present law |
| New entry rule | 62 | 1.1 | present law |
Witnessed. Figures altered for the case.
Table 4. The book against a fair walk on its own calendar
| Quantity | Witnessed | Fair walk (c = 0.8 to 1.0) |
|---|---|---|
| Births under the present exit law | 388 | — |
| Banks by the close | 286 | 315 to 330 |
| Deaths by the close | 5 | 1.3 to 3.5 |
| Still open at the close | 91 | 58 to 74 |
| Occupancy Share of those still open | read when resolved | a quarter to three tenths |
Fair-walk figures derived by applying each birth’s own lane geometry and birth time to 40,000 simulated paths per lane. The discrete five-minute step overstates deaths slightly; the Occupancy Share is quoted after correcting the death probability to its continuous value. Figures altered for the case.
Read together, the tables describe a book that looks worse than it is in one respect and better than it is in another. Its open inventory, which would alarm anyone comparing it with the death rate of births, sits where a fair walk would put it. Its capacity, which a count of closes would suggest is mostly spent on quick, profitable banks, is in fact spent mostly on slow banks and deaths, which together paid three quarters of its carry and earned almost nothing per day of the capacity they held. Neither picture is visible in a ledger that counts trades. Both are visible in a ledger that counts days.
References
Doob, J. L. (1953). Stochastic Processes. New York: Wiley.
Feller, W. (1971). An Introduction to Probability Theory and Its Applications, Volume II (2nd ed.). New York: Wiley. The waiting-time (inspection) paradox.
Ivantchev, B. (2025). Duration disparity in losing versus winning forex trades: evidence from individual traders’ behavior. Journal of Management and Financial Sciences, 55, 77–88.
Kaminski, K. M. and Lo, A. W. (2014). When do stop-loss rules stop losses? Journal of Financial Markets, 18, 234–254.
Little, J. D. C. (1961). A proof for the queuing formula L = λW. Operations Research, 9(3), 383–387.
López de Prado, M. (2018). Advances in Financial Machine Learning. Hoboken: Wiley. The triple-barrier method.
Odean, T. (1998). Are investors reluctant to realize their losses? Journal of Finance, 53(5), 1775–1798.
Shefrin, H. and Statman, M. (1985). The disposition to sell winners too early and ride losers too long. Journal of Finance, 40(3), 777–790.
Next in The Machine Readings
Scheduled Gaps: Paper III, on why a known event kills the positions born a week or two before it, and what a calendar can and cannot do.
Related reading
The Seven-Day Horizon: The Machine Readings, Paper I, on why a ledger reports its successes in hours and its failures in weeks.
The Fiscal Eigenvalue: why the slow mode of a system, not its fast one, decides whether it converges.
Two Fears, One Discount Rate: two fears priced through a single discount rate.
Download the PDF
About the Author
Dr. Glen Brown is President & CEO of Global Financial Engineering, Inc. and Global Accountancy Institute, Inc. He is the architect of the GCPIAUT framework and the broader GATS-native proprietary capital doctrine. His work focuses on sovereign capital governance, algorithmic trading architecture, reserve-first compounding systems, and institutional financial engineering within closed proprietary environments.
Business Model Clarification
Global Financial Engineering, Inc. and Global Accountancy Institute, Inc. operate as closed-loop proprietary institutions. They do not offer public investment products through the doctrines described herein, do not invite retail participation into their proprietary capital architecture, and do not present the GCPIAUT framework as a public collective investment scheme. The concepts discussed in this article are part of the firms’ internal intellectual and operating doctrine.
Risk Disclaimer
Trading and investment activity across foreign exchange, equities, futures, commodities, and digital assets involves substantial risk. Market conditions may change rapidly, and losses may occur. This article is provided for intellectual, institutional, and educational discussion only and does not constitute investment advice, an offer, a solicitation, or a recommendation to buy or sell any financial instrument or to participate in any investment structure.