The Machine Readings · Paper VIII
A sub-series of the Public Doctrine Series
Who Collects the Toll
Why a liquidity provider’s small edge becomes a near-certainty through frequency, why the same arithmetic condemns a taker whose toll exceeds its edge, and why a machine must make its edge positive before it makes it frequent
Dr. Glen Brown · President & CEO, Global Financial Engineering, Inc. and Global Accountancy Institute, Inc.
GFE-PUB-MR-20261103-H-CS · 3 November 2026
How to read this paper. The Machine Readings reason from a trading machine’s own records rather than from commentary on markets. Every claim of fact carries one of three marks. [W] Witnessed: read directly from a ledger or journal the machine wrote, from the venue’s price record, or from a published source named in the references. [D] Derived: computed from witnessed figures by a method this paper gives. [I] Inferred: an interpretation the evidence supports but does not compel. A sentence without a mark is argument, not evidence.
About the firms named. This paper refers to a liquidity provider and to a market maker by name. Everything said of them is drawn from their own public disclosures or from published reporting, and is cited. Nothing here describes their internal methods beyond what they have made public, and the illustrative figures in Figure 1 are not theirs.
About the case. The case in this paper is an illustration built from operating data. Every result is stated in units of the position’s own risk (R, where one R is the distance to the stop), never in money; the venue, the account and the dates are withheld, and nothing here reports the results of any account. The reasoning and the measurements are unaltered.
I. The Reading
Few firms in modern finance have grown as quickly, or with as few people, as XTX Markets. Founded in London in January 2015 as a spin-out of another quantitative firm, it had become the largest liquidity provider in spot foreign exchange by 2019 and the largest systematic internaliser in European equities in the same year. It now forecasts prices for more than fifty thousand instruments across equities, fixed income, currencies, commodities and digital assets, trades more than two hundred and fifty billion dollars a day, and does so with roughly three hundred employees. In 2022 it reported revenue of £2.5 billion and profit of £1.1 billion. [W]
Studying that record raises an observation that is simple to state and easy to underrate. The edge such a firm earns on any one trade is small, a fraction of the spread it quotes; what is large is the number of times it earns it. This paper takes the observation seriously. It asks what frequency does to an edge, for whom it works and against whom, and what it implies for a machine that does not quote prices but takes them, under a fixed bank and a fixed stop.
The answer is the companion to Paper VII of this series, The Toll and the Clock. Paper VII showed that, when the bank and the stop are fixed at birth, the cost of entering, the toll, decides the sign of each position. This paper shows that frequency decides how certainly that sign is expressed in the book. A liquidity provider collects the toll; a directional machine pays it. Both live by the same arithmetic, read from opposite sides.
II. The Mechanism
Frequency multiplies certainty, not edge
Let a book make N independent trades in a period, each with expected result e and dispersion σ. The expected result of the period is N·e. Its dispersion is σ·√N. [D] The ratio of the two, which governs how often the period finishes positive, is therefore (e/σ)·√N: it grows with the square root of the number of trades. [D] A hundredfold increase in frequency makes the outcome ten times more certain while leaving the edge of each trade exactly where it was. The investment literature has stated the same law for decades as the fundamental law of active management: the information ratio of a strategy is the quality of each independent bet times the square root of its breadth. [W]
Figure 1. How frequency turns a small edge into a near-certain period
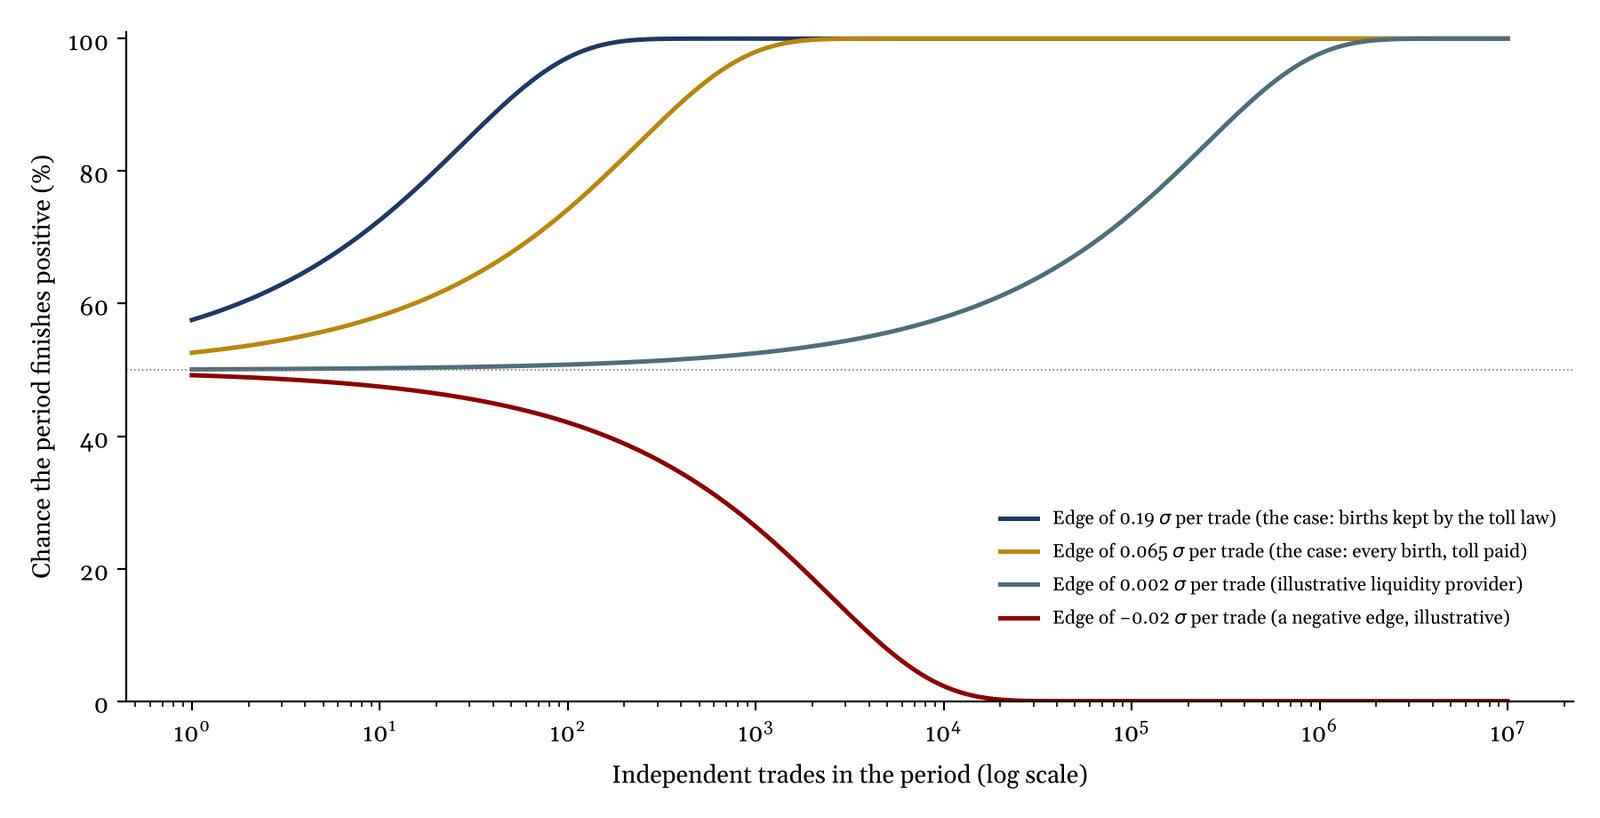
The chance that a period of N independent trades finishes positive, Φ((e/σ)·√N), for four edges per trade measured in units of the trade’s own dispersion σ. The two upper curves are the case of Section V; the third is an illustrative liquidity provider, not any firm’s actual figure; the fourth shows a negative edge. Derived. Results are in units of risk; money, venue, account and dates are withheld.
Figure 1 draws the consequence. An edge of two thousandths of a standard deviation per trade is invisible on a single trade and nearly invisible over a thousand; over a million it is close to certain. [D] This is the sense in which a market maker’s edge is “not big but frequent”: the edge is a sliver, and the frequency converts it into something that looks, day after day, like a salary. When the market maker Virtu Financial filed to list its shares in 2014, it reported a single losing day in 1,238 trading days. [W]
The same figure carries the warning. Frequency multiplies the sign of the edge as faithfully as its size. A negative edge of two hundredths of a standard deviation is a coin toss over ten trades and a certainty of loss over ten thousand. [D] Frequency does not create an edge; it removes the doubt about which one a book has.
The toll, seen from two sides
A liquidity provider quotes a price at which it will buy and a higher price at which it will sell. Every trader who crosses the spread pays it half the difference. Against that income stands one cost: the trader who crosses may know something, and the provider who traded with a better-informed counterparty loses on the price that follows. The classical models of dealer pricing reduce the provider’s edge to exactly these two terms, the spread collected less the adverse selection suffered. [W] A provider’s forecasting machinery exists to make the second term small: to move its quotes before the informed trader can reach them. [I]
A directional machine stands on the other side of the same transaction. Paper VII wrote its expected result per birth as E = edge − τ·D/S, where τ is the spread as a share of the bank and D/S the ratio of bank to stop. [D] The τ that is a cost to the taker is, in a competitive market, revenue to the maker. [I] One firm’s toll is the other’s income, and the same spread that makes the provider’s small edge certain at high frequency makes the taker’s small edge certainly negative at high frequency, whenever the toll exceeds the edge.
III. The Argument
First proposition: frequency is a multiplier of certainty, never of sign
No amount of frequency rescues a negative edge, and any amount of it condemns one. [D] The first question an engineer must answer about a trading machine is therefore not how often it trades but whether the edge it multiplies is positive after every cost it pays. Only then is frequency an asset. [I]
Second proposition: the order of engineering is sign, then frequency, then size
A machine should first make its edge positive, by refusing the trades whose toll consumes it; then make the edge frequent, by breadth across instruments and lanes; and only then make it large, by sizing. [I] Done in any other order, each step amplifies an error made in the step before: size raises the stakes of an edge whose sign is unknown, and frequency hastens a loss that a toll has already made certain. The toll law of Paper VII is the first step taken first.
Third proposition: the toll decides how long the truth takes to appear
Solve the √N law for the number of trades needed before an edge stands two standard errors clear of zero, and it becomes N* = (2σ/e)². [D] Because the toll subtracts from e, it does not merely lower the edge; it lengthens, quadratically, the time a book must wait before its own record can show whether the edge is there at all. [D]
Figure 2. The births a book must wait for before its edge can be seen, against the toll
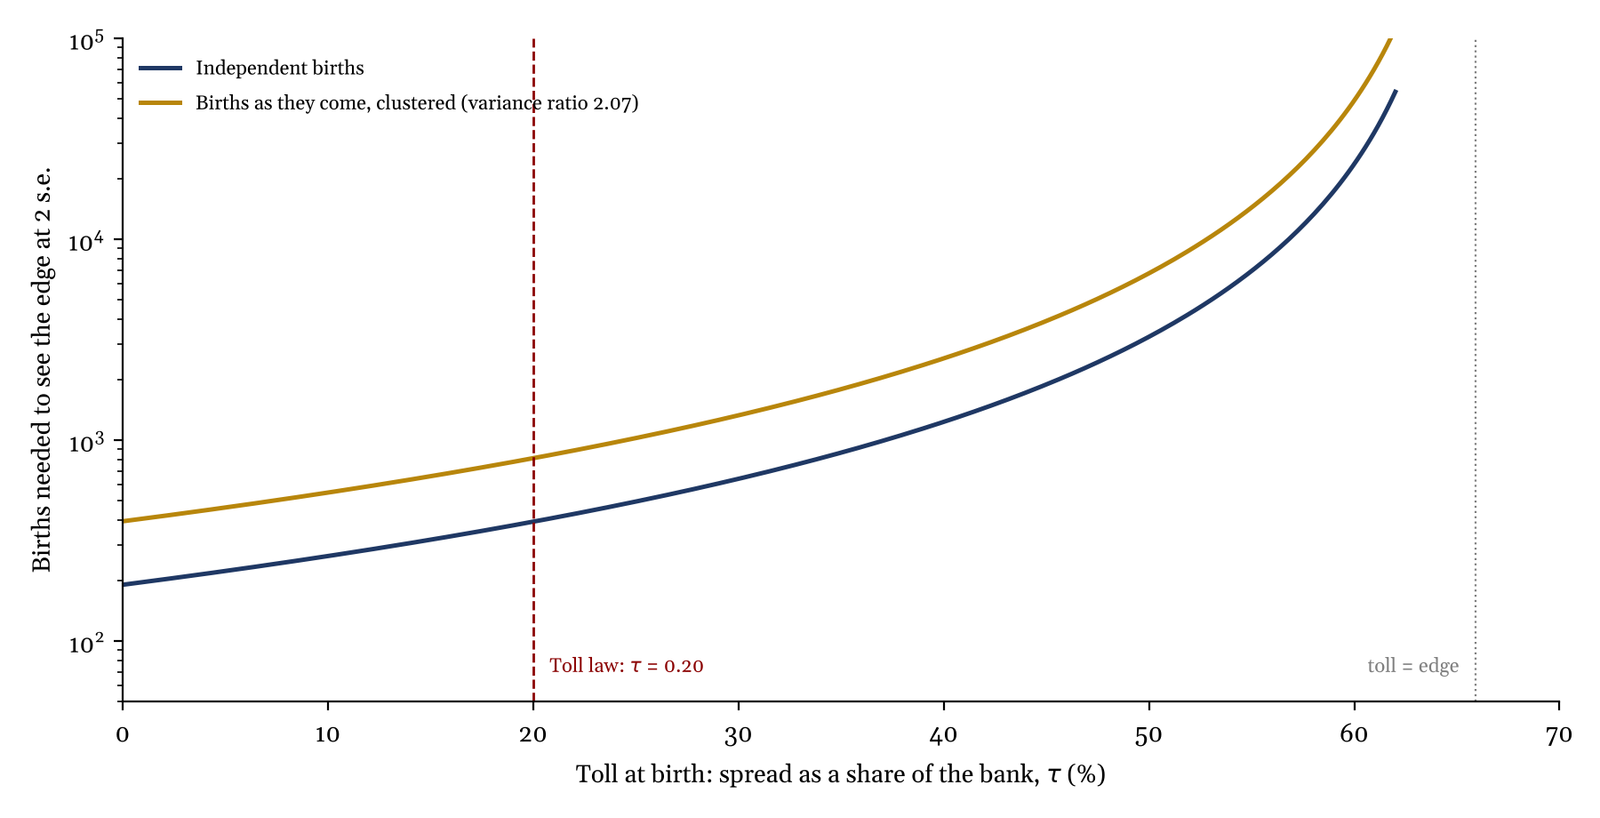
N* = (2σ/e)² with e = 0.029 R − τ·0.044 (the common edge and median bank-to-stop ratio of Paper VII) and σ = 0.20 R. Navy: independent births. Gold: births as they actually arrive, inflated by the measured variance ratio of 2.07 (Section V). Derived. Results are in units of risk; money, venue, account and dates are withheld.
With the edge and geometry measured in Paper VII, a book born at no toll can see its edge in about 190 independent births; at a toll of one-fifth of the bank, about 390; at two-fifths, about 1,230; at one-half, about 3,270; and as the toll approaches the edge itself, never. [D] A machine that admits dear births is not only earning less; it is choosing to be unable to know, for months, whether it is earning anything.
Fourth proposition: frequency is counted in independent trades
The √N law assumes that the trades are independent. Positions born together on related instruments are not: a session move, a factor, a shock reaches them all at once, and the dispersion of their sum grows faster than √N. [D] If the average correlation between trades in a period is ρ, a book of N trades behaves like one of N/(1+(N−1)ρ). [D] A correlation of a few hundredths, invisible in any single pair, halves the effective frequency of a book that makes two dozen trades a day. [D] Breadth is real only where it is independent; a hundred positions on one factor are, for this arithmetic, a few. [I]
Frequency does not create an edge. It removes the doubt about which one a book has.
Fifth proposition: the edge lives in the measurement
The firm this paper began with does what it does with about three hundred people, and its public record is one of research infrastructure: computing at scale, storage built for research data, engineers whose work is the speed of its models. [W] The lesson for a smaller house is not to imitate its business, which is a different business, but its ratio: very few people, and the whole of the edge in the machine and in the instruments that measure it. [I] A machine that cannot measure its own toll, its own independence and its own edge to the standard error cannot know which of the three to engineer next.
IV. What Would Falsify This Reading
The square-root test. Over periods of growing length, the dispersion of the book’s result must grow as the square root of its effective number of births. If it grows faster, the births are more correlated than measured and the effective frequency is lower than this paper claims; if it grows as N itself, the book is effectively one trade. [I]
The variance-ratio test. The ratio of the day-to-day dispersion of the book to the dispersion predicted from independent births was measured at 2.07. If, under the toll law and the narrower portfolio, the ratio rises, breadth is being bought on a common factor and the gain in frequency is illusory. [I]
The waiting test. Under the toll law the births kept carry an edge of about 0.19 standard deviations each. Their mean must stand two standard errors clear of zero within roughly two hundred to four hundred births, depending on how they cluster. If it has not after four hundred, either the edge is smaller than measured or the births are less independent than measured, and the paper must be revised. [I]
The sign test. If raising the frequency of the book, by adding instruments or lanes, lowers the mean result per birth, the new births are paying a toll the edge cannot carry, and the second proposition’s order has been broken. [I]
V. The Case
The case is a governed multi-asset book over six weeks, the same case as Paper VII: about a thousand births, some twenty-five a day. [W]
Table 1. The case in the arithmetic of frequency
| Quantity | Every resolved birth | Births the toll law keeps |
|---|---|---|
| Births | 835 | 312 |
| Mean result per birth, e | +0.014 R | +0.029 R |
| Dispersion per birth, σ | 0.21 R | 0.15 R |
| Edge per birth in units of σ, e/σ | 0.065 | 0.19 |
| Births to see the edge at 2 s.e., independent, (2σ/e)² | about 950 | about 110 |
| The same, at the measured variance ratio of 2.07 | about 1,970 | about 230 |
Resolved births only, which favours the quick banks and therefore flatters e; Paper VII sets out why. Derived from the birth ledger and the one-minute price record. Results are in units of risk; money, venue, account and dates are withheld.
Births per day were about 25. Across the 32 days with three or more resolved births, the day-to-day dispersion of their summed result was 2.07 times what independent births would give, an average correlation of about 0.04 between births of the same day, and therefore about 12 independent births a day where the ledger shows 25. [D] Three days in four finished positive. [D] A normal approximation to the same numbers predicts fewer, about three in five; the difference is the shape of the distribution, not an error: most days carry no death at all and finish positive, while the mean is carried down by the few days that do. [D] [I]
Table 1 is the paper’s argument in six rows. The toll law did not only raise the edge of the births it keeps; by raising e and lowering σ together, it cut the number of births the book must wait for before its edge can be seen from about 950 to about 110, or, as births actually cluster, from about 1,970 to about 230. [D] The book has since adopted the law, and its first births under it are too few, and too early, to be read. [W] The test of this paper is the one set in Section IV: the kept births must show their edge within a few hundred births, not a few thousand.
References
Grinold, R. C. (1989). The fundamental law of active management. Journal of Portfolio Management 15(3), 30–37.
Glosten, L. R. and Milgrom, P. R. (1985). Bid, ask and transaction prices in a specialist market with heterogeneously informed traders. Journal of Financial Economics 14(1), 71–100.
Ho, T. and Stoll, H. R. (1981). Optimal dealer pricing under transactions and return uncertainty. Journal of Financial Economics 9(1), 47–73.
Virtu Financial, Inc. (2014). Form S-1 Registration Statement, U.S. Securities and Exchange Commission: one losing trading day in 1,238.
XTX Markets: company history, scale, headcount and reported 2022 results, as summarised in the public record (Wikipedia, “XTX Markets”, accessed 3 November 2026), and the firm’s published research-infrastructure work.
Dr. Glen Brown (2026). The Toll and the Clock. The Machine Readings, Paper VII. Public Doctrine Series.
Earlier in The Machine Readings
The Seven-Day Horizon: Paper I, on why a ledger reports its successes in hours and its failures in weeks.
The Occupied Book: Paper II, on the Fair Walk Triad and why edge must be priced by the day.
Scheduled Gaps: Paper III, on why a known event kills the positions born a week or two before it.
A Deposit Is Not a Recovery: Paper IV, on why every return must be read against the capital of its own moment.
The Clock Is Not a Protector: Paper V, on why a drawdown circuit must be opened by recovery and not by the clock.
A Rebate Is Not a Deposit: Paper VI, on why income booked as capital is as wrong as capital booked as income.
The Toll and the Clock: Paper VII, on why, with the bank and the stop fixed, the cost of entering decides which way the book goes.
Download the PDF
About the Author
Dr. Glen Brown is President & CEO of Global Financial Engineering, Inc. and Global Accountancy Institute, Inc. He is the architect of the GCPIAUT framework and the broader GATS-native proprietary capital doctrine. His work focuses on sovereign capital governance, algorithmic trading architecture, reserve-first compounding systems, and institutional financial engineering within closed proprietary environments.
Business Model Clarification
Global Financial Engineering, Inc. and Global Accountancy Institute, Inc. operate as closed-loop proprietary institutions. They do not offer public investment products through the doctrines described herein, do not invite retail participation into their proprietary capital architecture, and do not present the GCPIAUT framework as a public collective investment scheme. The concepts discussed in this article are part of the firms’ internal intellectual and operating doctrine.
Risk Disclaimer
Trading and investment activity across foreign exchange, equities, futures, commodities, and digital assets involves substantial risk. Market conditions may change rapidly, and losses may occur. This article is provided for intellectual, institutional, and educational discussion only and does not constitute investment advice, an offer, a solicitation, or a recommendation to buy or sell any financial instrument or to participate in any investment structure.