The Machine Readings · Paper IX
A sub-series of the Public Doctrine Series
Breadth Is Not Shelter
Why a diversified book does not keep its risk profile when every asset is sold for cash, how many bets a book of many positions truly holds, and why the only shelter that survives is direction
Dr. Glen Brown · President & CEO, Global Financial Engineering, Inc. and Global Accountancy Institute, Inc.
GFE-PUB-MR-20261121-I-CS · 21 November 2026
How to read this paper. The Machine Readings reason from a trading machine’s own records rather than from commentary on markets. Every claim of fact carries one of three marks. [W] Witnessed: read directly from a ledger or journal the machine wrote, from the venue’s price record, or from a published source named in the references. [D] Derived: computed from witnessed figures by a method this paper gives. [I] Inferred: an interpretation the evidence supports but does not compel. A sentence without a mark is argument, not evidence.
About the case. The case in this paper is an illustration built from operating data. Every result is stated as a correlation, a ratio or a share, never in money; the venue, the account, the instruments’ names and the dates of the case are withheld, and nothing here reports the results of any account. The reasoning and the measurements are unaltered.
I. The Reading
On Friday 20 November 2026 the markets sold nearly everything at once. The S&P 500 fell 3.70 percent and the volatility index closed at 38.5. [W] Bitcoin fell below 59,000 dollars, within two percent of the low of its bear market, and about 1.5 billion dollars of leveraged positions in digital assets were liquidated in a day. [W] Gold, the asset an investor is told to hold for such a day, fell with the rest; the reports of the day put its loss between two and four and a half percent, depending on the hour at which they were written. [W] One of those reports named the condition exactly: a rush to cash that left few places to stand.
A belief is widely held about days like this one, and it is wrong. The belief is that a diversified book keeps its risk profile: that a book spread across equity indices, shares, currencies, commodities and digital assets carries, on a bad day, the same measured risk it carried on a quiet one, because its positions are many and different. The belief treats diversification as a property of the book, fixed when the book is built. It is not a property. It is a variable, and the thing it varies with is the one thing a diversified investor is relying on it to defeat.
This paper sets out why. It gives the arithmetic of what breadth removes and what it cannot; it shows why the part breadth cannot remove grows precisely when it matters; and it shows what is left of a book when that part has grown to fill it. It then reads a governed multi-asset book through a week of broad selling, position by position, at five-minute resolution. The reading contains one result the desk expected and one it did not, and both are reported.
II. The Mechanism
What breadth removes, and what it cannot
Take a book of N assets held at equal weight, each with the same risk σ, and let the average correlation between any two of them be ρ. The risk of the book is
σ(book) = σ · √( 1/N + (1 − 1/N) · ρ )
The expression has two terms and they behave differently. [D] The first, 1/N, is the part of each asset’s risk that is particular to it. It shrinks as assets are added and can be driven as near to zero as the investor has patience for. The second, ρ, is the part the assets share. No number of assets reduces it. As N grows without limit the risk of the book does not fall to zero; it falls to σ·√ρ and stops. [D] This is the oldest result in portfolio theory, and it is usually remembered as a promise. It is better read as a limit.
Figure 1. What adding assets does to risk, at four levels of average correlation
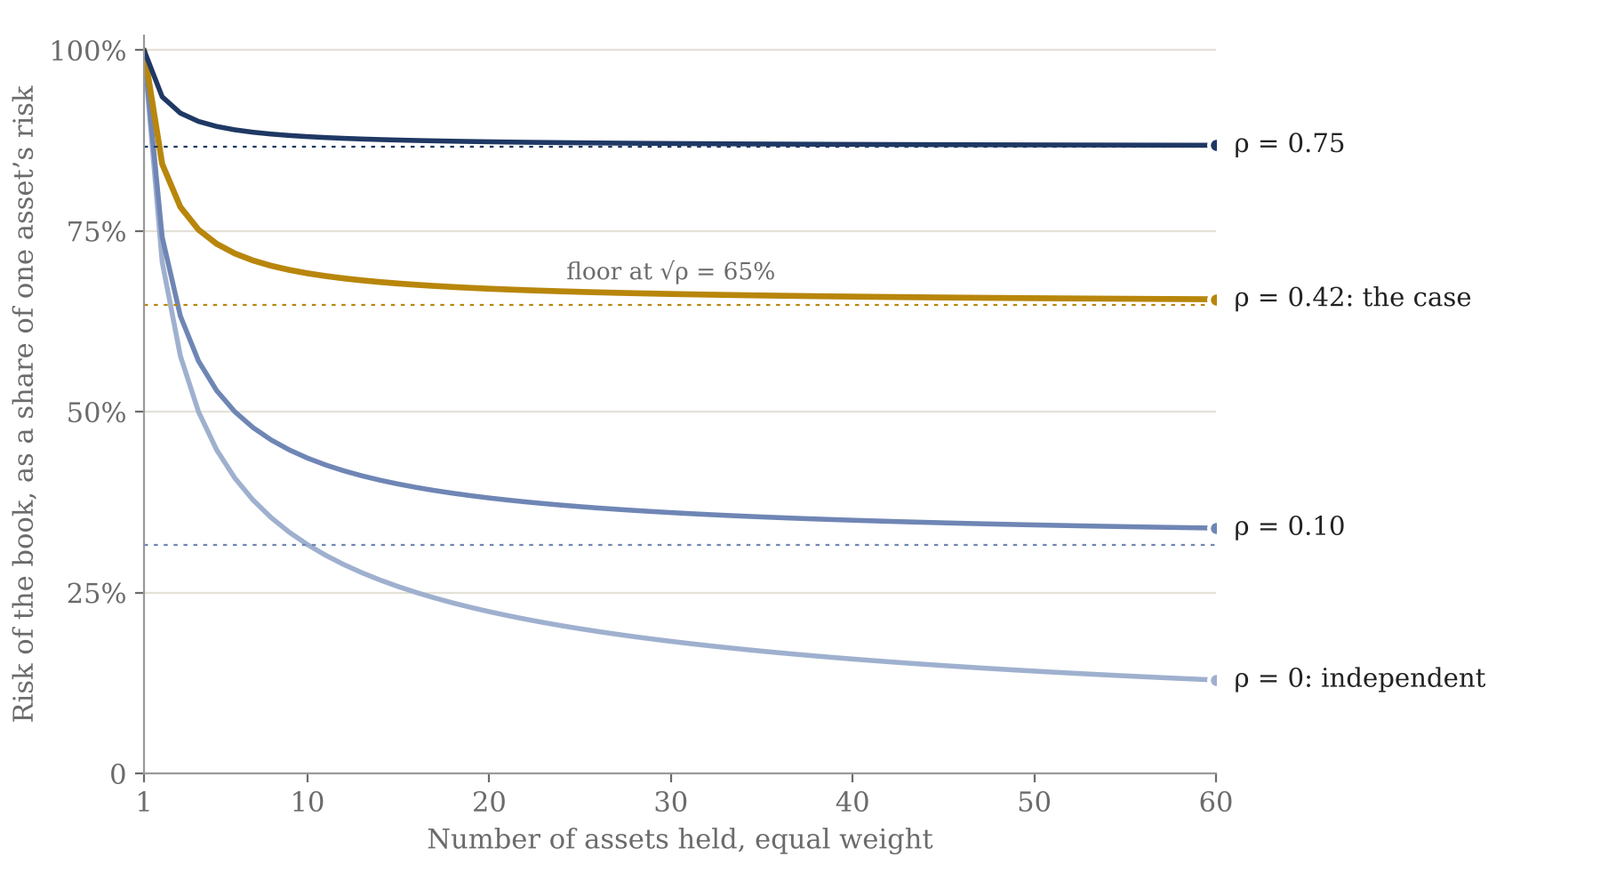
Risk of an equal-weight book as a share of one asset’s risk, σ(book)/σ = √(1/N + (1 − 1/N)ρ). The dotted line under each curve is its floor, √ρ. The gold curve is drawn at the average correlation measured in the case of Section V. Derived.
Figure 1 draws the limit. With no correlation, a book of sixty assets carries 13 percent of the risk of one. With an average correlation of one-tenth it carries 34 percent, and it had most of that benefit by the twentieth asset. With an average correlation of 0.42 it carries 65 percent, and the tenth asset was the last that made a visible difference. [D] Past that point every further position adds a line to the ledger and almost nothing to the shelter.
The same arithmetic can be stated as a count. Paper VIII of this series used it for trades through time; it applies unchanged to positions held together. A book of N positions with average correlation ρ behaves like a book of
N(effective) = N / ( 1 + (N − 1) · ρ )
independent positions. [D] As N grows this number does not grow with it. It approaches 1/ρ and stays there. [D] At an average correlation of one-quarter no book, however broad, holds more than four independent bets. At one-half it holds two. The count on the ledger is a fact about the bookkeeping. The number of bets is a fact about the market, and only the second is risk.
Why the shared part grows when it matters
Why should ρ change at all? The simplest model that answers the question supposes that each asset’s move is the sum of two parts: a move common to all of them, driven by one factor, and a move of its own. If the assets load on the factor equally, the correlation between any two is
ρ = 1 / ( 1 + θ ), θ = variance particular to the asset ÷ variance due to the common factor
Nothing in this expression describes how strongly the assets are linked. [D] It contains only a ratio of two variances. When the common factor is quiet, θ is large and ρ is small: the assets appear nearly independent, and a book built in that season looks superbly diversified. When the common factor becomes violent, θ falls and ρ rises, although no link between any two assets has changed. If the particular variance is three times the common, ρ is one-quarter; let the common variance triple and ρ is one-half. [D] The effective number of bets has halved, and the book has not been touched.
The literature has measured this for a generation. Correlations between national equity markets rise in the lower tail and not in the upper; they are higher in falling markets than a normal distribution allows. [W] Correlations between shares and the market are larger for downward moves than for upward ones. [W] And the caution that belongs beside both findings is the one the expression above already contains: much of the measured rise in correlation during a crisis is the arithmetic consequence of higher common variance, with the underlying dependence unchanged. [W] For the holder of a book the distinction is of no comfort. Whether the links tightened or the common move merely grew, the bets have become fewer.
A flight to cash is the purest case. The common factor is the demand for cash itself, and every asset that is not cash loads on it with the same sign, because every asset can be sold to raise it. That is why gold fell on the day equities fell, and why digital assets, which share no cash flow with either, fell further than both. [I] Assets chosen because they respond to different things turn out to respond, on that day, to one thing.
What survives in a book that holds both sides
The arithmetic so far assumes a book that only buys. A book that both buys and sells is described by one more line. Give each position a sign s, plus one if it is bought and minus one if sold, a weight w, and a loading β on the common factor. The variance of the book is
Var(book) = ( Σ s·w·β )² · Var(factor) + Σ w² · Var(particular)
The second term is the diversifiable part, and it is unaffected by the signs. The first is the common part, and the signs are the whole of it. [D] When the factor is quiet the second term governs and the book’s breadth is what protects it. When the factor dominates, the second term becomes negligible beside the first, and the risk of the book reduces to a single quantity: its net loading on the factor, Σ s·w·β, multiplied by the factor’s move. [D] Two long positions that were nearly unrelated become one position. A long and a short that were nearly unrelated become a hedge. The book of many positions becomes a book of one number.
On the day everything is sold for cash, a book is not its breadth. It is its direction.
III. The Argument
First proposition: breadth removes only what is particular
Adding positions reduces the risk that belongs to each position alone and leaves untouched the risk they hold in common. [D] A book is therefore diversified against accidents and not against the market. An investor who counts positions is measuring protection against the first and reading it as protection against the second.
Second proposition: the number of bets is bounded by the correlation, not by the count
However many positions a book holds, its effective number cannot exceed 1/ρ. [D] Breadth beyond a handful of positions is bought at the full cost of each position, in spread, in margin and in attention, and returns almost nothing in shelter. The engineering question is never how many positions a book holds. It is how many different things it is exposed to, and that question has a small answer.
Third proposition: the risk profile of a diversified book is a variable
Because ρ is a ratio of variances and the common variance is not constant, the risk of a diversified book changes without any change to the book. [D] A risk figure computed in a quiet month is a statement about that month. The answer to the question whether a diversified book maintains its risk profile is no, and the reason is not that diversification fails. It works exactly as the arithmetic says. The arithmetic says it depends on a quantity that rises in a crisis.
Fourth proposition: when the common factor dominates, shelter is a direction
In the limit the only term of the book’s risk that survives is its net loading. [D] The positions that protect a book through a broad sell-off are therefore not its additional longs in other asset classes. They are the positions that stand on the other side of the factor. [I] A book that takes its direction, asset by asset, from the slower structure of each market will be short the assets whose structure has already turned and long those whose structure has not, and it is that mixture, not the number of names, that it carries into the day.
Fifth proposition: a budget must be written for the day the correlation is one
If the shared part of risk can grow to fill the book, a limit on risk must be set against that case and not against the average one. [I] The sound prior is that every position exposed to a factor on the same side loses together, in full, and that the two sides of a factor are counted separately because one of them banks while the other bleeds. Evidence may loosen that prior, slowly and within bounds; a quiet season may not. The usual practice runs the other way. It assumes independence until a week disproves it, and the week that disproves it is the week the assumption was needed.
IV. What Would Falsify This Reading
The calm-week test. The case that follows was measured through a week of selling and has no quiet week beside it. The mechanism of Section II predicts that the same measures, taken on the same book in a quiet week, read materially lower: a smaller average correlation and a larger effective number. If they do not, the book is concentrated at all times and the crisis is not the cause. That would be a stronger finding than this paper’s, and a different one. [I]
The ceiling test. The effective number of bets must stay at or below 1/ρ as positions are added. If a book adds positions within a class and its effective number rises in proportion, the positions are more independent than measured and the second proposition is overstated for that class. [I]
The sign test. In a broad sell-off, the mark of the sold positions must move against the mark of the bought ones. If the two sleeves fall together, the shelter of the fourth proposition is absent, and what protected the book was something else. [I]
The budget test. If, over many such weeks, the positions on one side of a factor never approach their stops together, the prior of the fifth proposition is too severe and costs the book capacity for nothing. The evidence that would relax it is the worst share of a factor’s loss-at-the-stop actually reached in each week, recorded week by week. [I]
V. The Case
The case is a governed multi-asset book through a week of broad selling. It opened the week with no positions and by its close had opened 221, across equity indices, shares, currencies, digital assets and agricultural contracts, on both sides of the market. [W] The machine that runs it records the mark of every open position every five minutes. [W] From that record the hourly move of each asset held, and of each position, can be computed, and with them the correlations that Section II is about.
Table 1. How closely the assets moved, over the week
| Assets compared | Pairs | Mean correlation of hourly moves |
|---|---|---|
| Equity indices with each other (10 held) | 45 | 0.63 |
| Six indices of one region with each other | 15 | 0.74 |
| Shares with each other (13 held) | 38 | 0.28 |
| Equity indices with digital assets | 28 | 0.50 |
| Equity indices with shares | 100 | 0.36 |
| Shares with digital assets | 26 | 0.34 |
| All risk assets with each other (27 held) | 239 | 0.42 |
Hourly moves of each asset, from the five-minute mark of the position held longest in it, with the position’s own direction removed. A pair is counted when it has at least eight hours in common. Currencies are left out because a currency pair has no natural “up”. Derived from the machine’s position record.
Across the twenty-seven risk assets the book held, the mean correlation of hourly moves over the week was 0.42. [D] The arithmetic of Section II then gives the book’s breadth its true size: twenty-seven assets, 2.3 independent bets, against a ceiling of 2.4 that no further asset could have raised. [D] The ten equity indices were one and a half bets. Equity indices and digital assets, which share no earnings, no issuer and no regulator, moved together with a correlation of one-half. [D]
Figure 2. What the book held, and how many independent bets that was
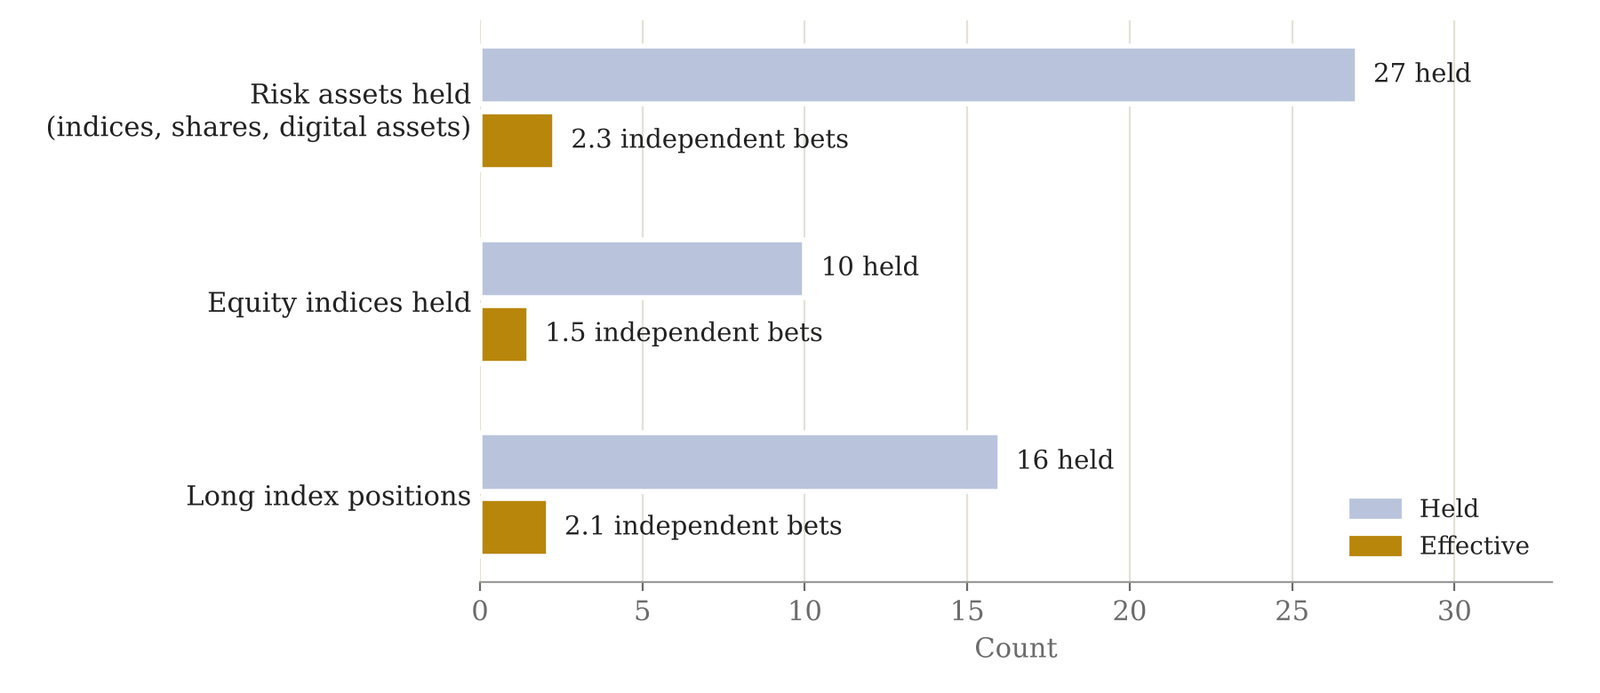
Assets or positions held against their effective number over the week. For assets, N/(1 + (N − 1)ρ) with the correlations of Table 1. For the sixteen long index positions, the count divided by the measured variance ratio of Table 2. Derived.
Table 2. The same measures, day by day
| Measure | Second day | Third day | Fourth day | Fifth day |
|---|---|---|---|---|
| Mean correlation, all risk assets | 0.65 | 0.42 | 0.42 | 0.36 |
| Effective number of the 27 risk assets | 1.5 | 2.3 | 2.3 | 2.6 |
| Variance ratio, 16 long index positions (1 = independent, 16 = one bet) | 7.9 | 7.5 | 7.1 | 7.7 |
| Variance ratio, whole book (1 = independent) | 3.0 | 2.8 | 4.0 | 5.9 |
| Correlation of the bought sleeve’s mark with the sold sleeve’s | −0.74 | −0.60 | −0.69 | −0.70 |
The variance ratio is the variance of the summed hourly mark changes of a group of positions divided by the sum of their separate variances, in money. The first day is omitted: the book was still being opened. The fifth day is the day of the broadest selling. Derived from the machine’s position record.
Two readings come out of Table 2. The first is the one the desk expected and it is confirmed. Sixteen long positions on six equity indices of one region behaved, on every day of the week, as about two positions: their summed variance was between seven and eight times what sixteen independent positions would give. [D] Those sixteen positions carried 88 percent of the book’s open loss at the week’s end. [D] With them the book had banked 0.54 for every 1.00 of floating loss it carried; without them, 4.44. [D] Their factor reached 43 percent of the way to its stops at the worst moment of the fifth day, and no position in the book reached its stop in the week. [W]
The second reading is the one the desk did not expect, and it is the more instructive. The correlation between assets did not jump on the day of the broadest selling. It was highest on the second day and lowest on the fifth. [D] The belief this paper sets out to correct imagines a book that is diversified until the crisis arrives. The record shows a book whose risk assets were two or three bets from the first hour of a week in which every day was a day of selling. [I] The crisis did not undo the diversification on Friday. The breadth had been a matter of the ledger all week, and Friday was the day its absence was priced. What did rise on the fifth day was the concentration of the whole book in money: its variance ratio went from about three to about six as the largest positions moved furthest. [D]
The fourth proposition is visible in the last row. The mark of the sold positions moved against the mark of the bought ones on every day, with a correlation between −0.60 and −0.74. [D] Over the four days the sold sleeve’s marks recovered about 27 percent of what the bought sleeve’s marks gave up. [D] The book’s shelter through the week was that sleeve: the equity indices and digital assets whose slower structure had already turned, and which the machine was therefore short. The other asset classes on the long side gave it nothing, because on those days they were not other.
The machine in the case is governed by a factor budget written on the prior of the fifth proposition: every position on one side of a factor is assumed to reach its stop together, the two sides are counted separately, and the assumption relaxes only as recorded weeks earn it. [W] The budget admitted the sixteen positions, because their loss at the stop was within what the book’s drawdown limit allows. It was written to keep the book alive on the day correlation is one, and through this week it did. Whether a budget should also ask what a factor’s floating loss does to the rate at which a book’s equity can rise is a separate question, which the week raised and which this paper leaves open.
References
Markowitz, H. (1952). Portfolio selection. Journal of Finance 7(1), 77–91.
Longin, F. and Solnik, B. (2001). Extreme correlation of international equity markets. Journal of Finance 56(2), 649–676.
Ang, A. and Chen, J. (2002). Asymmetric correlations of equity portfolios. Journal of Financial Economics 63(3), 443–494.
Forbes, K. J. and Rigobon, R. (2002). No contagion, only interdependence: measuring stock market comovements. Journal of Finance 57(5), 2223–2261.
Kish, L. (1965). Survey Sampling. New York: John Wiley & Sons. The design effect and the effective sample size.
Yahoo Finance (20 November 2026). Live market report for the United States session: index closes and the volatility index.
CoinDesk (20 November 2026, 18:57 UTC). “Bitcoin plunges below $59,000 as rush to cash puts new bear market lows back in play”, as carried by Cryptonews.
Dr. Glen Brown (2026). Who Collects the Toll. The Machine Readings, Paper VIII. Public Doctrine Series.
Earlier in The Machine Readings
The Seven-Day Horizon: Paper I, on why a ledger reports its successes in hours and its failures in weeks.
The Occupied Book: Paper II, on the Fair Walk Triad and why edge must be priced by the day.
Scheduled Gaps: Paper III, on why a known event kills the positions born a week or two before it.
A Deposit Is Not a Recovery: Paper IV, on why every return must be read against the capital of its own moment.
The Clock Is Not a Protector: Paper V, on why a drawdown circuit must be opened by recovery and not by the clock.
A Rebate Is Not a Deposit: Paper VI, on why income booked as capital is as wrong as capital booked as income.
The Toll and the Clock: Paper VII, on why, with the bank and the stop fixed, the cost of entering decides which way the book goes.
Who Collects the Toll: Paper VIII, on why frequency multiplies the certainty of an edge and never its sign.
Download the PDF
About the Author
Dr. Glen Brown is President & CEO of Global Financial Engineering, Inc. and Global Accountancy Institute, Inc. He is the architect of the GCPIAUT framework and the broader GATS-native proprietary capital doctrine. His work focuses on sovereign capital governance, algorithmic trading architecture, reserve-first compounding systems, and institutional financial engineering within closed proprietary environments.
Business Model Clarification
Global Financial Engineering, Inc. and Global Accountancy Institute, Inc. operate as closed-loop proprietary institutions. They do not offer public investment products through the doctrines described herein, do not invite retail participation into their proprietary capital architecture, and do not present the GCPIAUT framework as a public collective investment scheme. The concepts discussed in this article are part of the firms’ internal intellectual and operating doctrine.
Risk Disclaimer
Trading and investment activity across foreign exchange, equities, futures, commodities, and digital assets involves substantial risk. Market conditions may change rapidly, and losses may occur. This article is provided for intellectual, institutional, and educational discussion only and does not constitute investment advice, an offer, a solicitation, or a recommendation to buy or sell any financial instrument or to participate in any investment structure.