The Instruments of Capital · Paper X
Volatility as an Asset
The quantity in which every other risk in this series is measured can itself be bought and sold. What is held when volatility is held, and what it costs to wait.
Dr. Glen Brown · Global Financial Engineering, Inc. · Global Accountancy Institute, Inc. · 14 November 2026 · GFE-PUB-IOC-20261114-H
About this series
The Instruments of Capital is a sub-series of the Public Doctrine Series. It sets out, one class at a time, every kind of asset a proprietary firm could trade, whether or not the firm trades it today. Each paper puts its subject through the six questions set in Paper I: claim, structure, return, carry, ending and risk unit. The case in Section VIII is an illustration built from operating data. Its figures have been altered and it reports no account’s results.
I. A measurement that acquired a price
Every paper in this series has ended on the same quantity. The sixth question asks for the unit in which an instrument’s risk should be measured, and the answer has each time been some form of volatility: how much the price moves. Volatility has been the ruler. This paper concerns the instruments that put the ruler itself up for sale.
The idea followed from the option. Paper VIII showed that an option’s price is in effect a quotation of volatility, since volatility is the only term in the pricing formula that cannot be observed. It was a short step to turn the quotation round: to take the prices of options and compute from them the volatility the market expects. In 1993 an exchange in Chicago began publishing such a figure for the American share market, on a method proposed by Robert Whaley. In 2003 the method was revised to draw on options across the whole range of strikes on the leading index. Futures on the figure were listed in March 2004 and options on it in 2006.
The market in these contracts is substantial. In 2025 some 215.6 million options on the index were traded, an average of 862,000 a day; in the first quarter of 2026 the average was close to one million a day, and in March 2026 futures on the index averaged 318,000 contracts a day. Alongside the listed market, dealers write contracts that pay on the volatility actually realised by an index, a share, a currency or a rate.
Volatility cannot be held. Every instrument that offers it is a contract on a number computed from other prices.
II. The claim
There are two different things called volatility, and an instrument is a claim on one or the other. Realised volatility is a fact about the past: the measured variability of a price over a period that has ended. Implied volatility is a price in the present: the level of future variability at which options are currently changing hands. The first is calculated from the asset. The second is calculated from options on the asset.
Table 1. Five ways of holding volatility
| Instrument | What it pays | Who owes it |
|---|---|---|
| An option held and hedged | The movement the asset actually makes, less the movement the option’s price assumed | The option writer, through the clearing house if listed |
| Variance swap | The realised variance of the asset over the term, less a level fixed at the start, on a stated amount | The dealer |
| Future on a volatility index | The level of the index on the expiry date, less the price paid | The clearing house |
| Option on a volatility index | The excess of the index on the expiry date over a strike, or the reverse | The clearing house |
| Exchange-traded product | The return of a position in volatility futures renewed daily, less a fee | The fund’s assets, or the issuing bank if it is a note |
The first two pay on what the asset does. The last three pay on what option prices are on a particular morning.
The distinction in the note to Table 1 is the one most often missed. A variance swap is a claim on events: if the index moves more than was agreed, the holder is paid. A future on a volatility index is a claim on an opinion: it pays according to what the options market expects on the day the future expires, which need not be what has just occurred. Both are called buying volatility.
III. The structure
A volatility index is not an asset and cannot be bought. It is a calculation, published through the day, from the bid and offer prices of some hundreds of options. There is no means of holding today’s value of it and selling the same holding tomorrow. The only tradable instruments are contracts that settle against its value on a future date.
This has a consequence that surprises almost everyone who meets these instruments. The future does not follow the index point for point. If the index rises sharply on bad news, a future expiring in three months rises by much less, since the market expects the alarm to have faded by then. The price of each future is the market’s estimate of where the index will stand on that future’s expiry date, and a distant future may be little moved by a spike in the index.
Volatility has two properties that govern all of this and that no share price has. It clusters: Mandelbrot observed in 1963 that large changes tend to be followed by large changes and small by small, and Engle gave the observation a statistical form in 1982. And it returns towards a long-run level; a share price that doubles may stay doubled, but a volatility of sixty per cent does not persist. An instrument on volatility is therefore an instrument on something that jumps, lingers and subsides.
Finally, the settlement value of the listed contracts is taken from an auction of options on the expiry morning. The final value of a volatility future thus depends on the opening prices of a large set of options, some of them seldom traded. Griffin and Shams reported in 2018 that trading in those options rose around settlement in a pattern consistent with attempts to move the result. The exchange disputed the finding. It is at least clear that the number on which these contracts settle is constructed, and that its construction has been contested.
IV. The return
Paper VIII reported that option prices have on average assumed more movement than followed. The same fact, stated for this paper’s instruments, is that buyers of volatility have on average lost. Carr and Wu measured the return to buying realised variance on American indices through variance swaps and found it strongly negative over their sample. The loss is the premium that the rest of the market pays to be insured.
What the buyer obtains for that premium is a position that gains when most others lose. In share markets volatility and prices move in opposite directions, a regularity noted by Fischer Black in 1976: prices fall quickly and rise slowly, and volatility rises when they fall. A holding of share-market volatility therefore tends to pay in exactly the conditions in which a share portfolio is losing. It is the nearest thing in the series to pure insurance, and it is priced as insurance is priced, at more than its expected payout.
The seller of volatility is on the other side and has the insurer’s return: a steady income interrupted by large losses. Much of what has been sold to investors as an income strategy over the past two decades has been this position in one form or another.
V. The carry
The cost of holding volatility through listed futures is the largest carry described in this series. In ordinary conditions the futures stand above the index, and more distant futures stand above nearer ones, since a calm present is expected to be followed by something less calm. A long position must be renewed as each future expires, by selling a contract that has drifted down towards the index and buying a dearer one. Paper VII called this the cost of rolling in contango. In volatility it has at times run at several per cent a month.
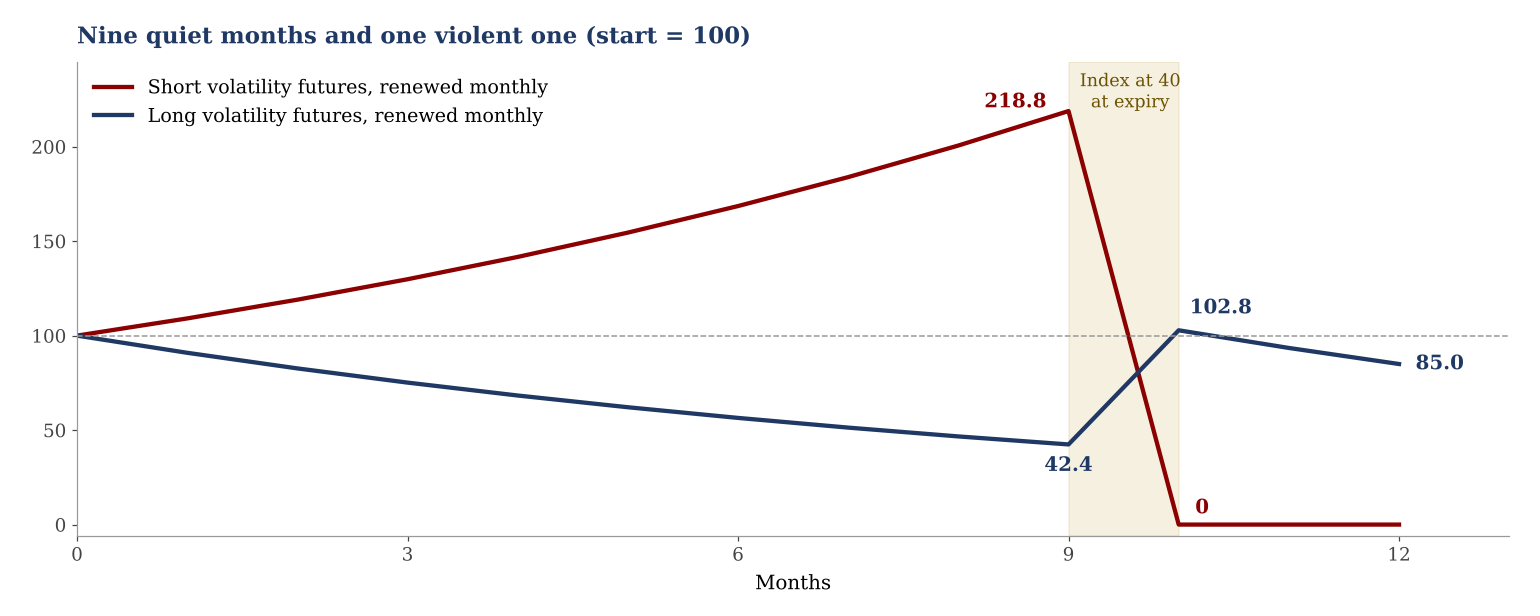
Figure 1. Illustration. A volatility index stands at 15 and the one-month future at 16.5 for nine months; in the tenth month the index is at 40 when the future expires; the last two months are as the first nine. A fully collateralised long position renewed monthly falls to 42.4, recovers to 102.8 and ends at 85.0. The matching short position rises to 218.8 and is extinguished in the tenth month. Calculated on stated assumptions; no market data.
Figure 1 sets out the arithmetic on assumptions chosen to be plain and not extreme. The long holder loses more than half the stake in nine quiet months and is roughly restored by one violent one. The short holder more than doubles the stake over the same nine months and loses all of it in the tenth. Neither outcome depends on any change in the long-run level of volatility. The whole of both results is carry and one event.
For a variance swap the carry is less visible and of the same kind. Each quiet day that passes is a day on which realised variance fell short of the level paid for.
VI. The ending
Contracts on volatility expire like any future or option, at a value fixed by the settlement procedure described above. The endings that matter are those of positions and products, and they are sudden.
On Friday 2 February 2018 the principal American volatility index closed at 17.31. On Monday 5 February it closed at 37.32, a rise of 116 per cent and the largest one-day proportional rise in its history. Exchange-traded products that were short volatility futures were obliged by their terms to buy futures at the close in proportion to the rise, and their buying drove the futures higher still in the last minutes. The best known of them lost more than nine-tenths of its value in the session and was terminated by its issuer. It had multiplied its holders’ money several times over in the preceding years. Paper VI mentioned the episode as an example of a note’s early termination; here it is the plain case of the short side of Figure 1.
On 5 August 2024, before the American market opened, the same index was published at 65.73, a level otherwise seen only in the crises of 2008 and 2020. It closed that day at 38.57. Subsequent analysis attributed much of the early reading to option quotations that had widened in thin pre-market trading, the index being computed from quotations and not from trades. The futures moved far less than the index. The episode is a reminder that the index is a calculation whose inputs can fail to mean what they usually mean.
There is one further ending, which follows from the tendency of volatility to subside. A long position that has gained in a crisis holds a gain that will decay if it is not taken. An instrument bought as insurance pays only if someone decides, in the middle of the event insured against, to collect.
VII. The risk unit
The risk unit of a volatility position is the volatility of volatility, and it is very large. The principal American index has itself varied at something like eighty to one hundred per cent a year, several times the variability of the share market it describes. A position that looks small by the money committed can carry the risk of a much larger position in shares.
The contracts that pay on realised variance add a second feature. Variance is the square of volatility. A contract that pays on variance gains more than proportionally as movement increases, so that the seller’s loss in an extreme month is far greater than a calculation based on ordinary months suggests. Several dealers and funds learned this in the autumn of 2008.
The third feature is the asymmetry already shown. For the buyer the worst case is the loss of what was paid, slowly. For the seller the worst case is large, fast and uncertain in size. A risk unit taken from the recent behaviour of a short volatility position will be smallest immediately before it is most needed, since the quietest periods precede the spikes.
Table 2. The six questions answered for volatility
| Question | Answer |
|---|---|
| Claim | A contract on a number: either the variability an asset goes on to show, or the level of an index computed from option prices on a stated date. On a clearing house or a dealer; nothing is owned |
| Structure | An index that cannot be held; futures that are forecasts of it and do not follow it point for point; settlement by an auction of options; a quantity that jumps, clusters and subsides |
| Return | Negative on average for the buyer, who is buying insurance that pays when share markets fall; positive on average for the seller, with rare large losses |
| Carry | For the buyer, the heaviest in the series: the decline of each future towards the index, or each quiet day under a variance swap. The mirror for the seller |
| Ending | Expiry at a constructed settlement value. For short positions and the products built on them, a single session |
| Risk unit | The volatility of volatility, several times that of shares; more than proportional for contracts on variance; for the seller, the worst case and not the recent record |
The answers are for share-market volatility, where the listed market is deepest. Contracts on the volatility of currencies, rates and commodities are mostly agreed with dealers and lack the strong inverse link to the price of the asset.
VIII. The case
The following illustration is drawn from multi-asset books that held no instrument on volatility. They are of interest here for the opposite reason: volatility entered every decision they made, and the books therefore held a position in it without holding a contract.
When considering a position, a book of this kind measured the recent range of the instrument’s price over three windows, a short, a medium and a long one, on the time scale of the intended trade. It took the ratio of the short measure to the long as a reading of whether the instrument was quieter or more active than usual, and classed the reading into bands from very quiet to very active. The protective stop was then derived from these measures and from the time scale of the trade, and the size of the position was whatever made a close at that stop cost the intended fraction of capital. In one evening’s record a book took several hundred such readings on a dozen instruments. The short measure stood between roughly four-fifths and five-quarters of the long one throughout, and the readings fell in the quiet, normal and active bands, with the normal the most frequent.
Consider what that procedure commits the book to. The distance of the stop is a statement about how far the price may move without the trade being wrong, and it is made from past movement. If the instrument then becomes more volatile than the measurement implied, a stop set in a calm period stands too close and is reached by movement that carries no information; the book is in the position of a seller of volatility, and loses when volatility rises. If instead the price moves far in the trade’s favour, the position has a fixed loss behind it and an open gain ahead, the shape Paper VIII compared to a bought option, and the book is in the position of a buyer of movement. Fung and Hsieh showed in 2001 that the returns of funds following trends resemble those of a holder of options that pay on large moves in either direction.
The book is thus exposed to volatility in two opposite ways at two stages of a trade’s life, with no volatility instrument anywhere in it. Which exposure prevails is an empirical matter for each book. The books in question recorded the volatility reading and its band with every entry so that the later fate of positions could be compared across bands. This paper reports the method and the record’s existence. It does not report the comparison.
The point for the series is this. Volatility need not be bought to be owned. Any rule that sizes a position from measured movement has taken a view on future movement, and any book that cuts losses at a fixed distance and lets gains run has an option-like dependence on how large the moves turn out to be. A firm that never trades a volatility contract still has to answer the six questions about volatility, since it is already in the trade.
IX. What would falsify this reading
The claim that buyers of volatility lose on average rests chiefly on American share indices since about 1990. It is weaker for individual shares and for other asset classes, and it describes an average that includes the months in which the buyer was paid many times over. It would be overturned by a long sample, containing crises, in which the realised figure had matched or exceeded the level paid.
Figure 1 is an illustration on stated assumptions and not a history. Its nine quiet months and its single spike are chosen for clarity. The actual ratio of quiet months to violent ones, and the actual steepness of the futures curve, vary; the figure shows the mechanism and proves nothing about its frequency.
The case asserts that a book sized from measured movement holds an implicit position in volatility. That is an argument, supported by the cited literature on trend-following funds, and not a measurement on the books described. The comparison of outcomes across volatility bands would test it. If positions opened in quiet and in active conditions proved to fare alike, the practical weight of the argument for those books would be small.
With this paper the series leaves the contract forms. The next four papers turn to the goods themselves, beginning with energy.
References
Black, F. (1976). Studies of stock price volatility changes. Proceedings of the 1976 Meetings of the American Statistical Association, Business and Economic Statistics Section, 177–181.
Carr, P. and Wu, L. (2009). Variance risk premiums. Review of Financial Studies 22(3), 1311–1341.
Cboe Global Markets (2026). Reports of trading volume for December and full year 2025 (6 January 2026) and for March 2026 (6 April 2026); Market Metrics That Matter, March 2026.
Demeterfi, K., Derman, E., Kamal, M. and Zou, J. (1999). More than you ever wanted to know about volatility swaps. Goldman Sachs Quantitative Strategies Research Notes.
Dr. Glen Brown (2026). Indices, Funds and Exchange-Traded Products; Futures and Forwards; Options. The Instruments of Capital, Papers VI, VII and VIII. Public Doctrine Series.
Engle, R. F. (1982). Autoregressive conditional heteroscedasticity with estimates of the variance of United Kingdom inflation. Econometrica 50(4), 987–1007.
Fung, W. and Hsieh, D. A. (2001). The risk in hedge fund strategies: theory and evidence from trend followers. Review of Financial Studies 14(2), 313–341.
Griffin, J. M. and Shams, A. (2018). Manipulation in the VIX? Review of Financial Studies 31(4), 1377–1417.
Mandelbrot, B. (1963). The variation of certain speculative prices. Journal of Business 36(4), 394–419.
Whaley, R. E. (1993). Derivatives on market volatility: hedging tools long overdue. Journal of Derivatives 1(1), 71–84.
Related in the Public Doctrine Series
Options: The Instruments of Capital, Paper VIII, where an option’s price is shown to be a quotation of volatility.
Futures and Forwards: The Instruments of Capital, Paper VII, on the cost of renewing a futures position when later months stand higher.
What an Asset Class Is: The Instruments of Capital, Paper I, which sets the six questions, the last of them the risk unit.
Download the PDF
About the Author
Dr. Glen Brown is President & CEO of Global Financial Engineering, Inc. and Global Accountancy Institute, Inc. He is the architect of the GCPIAUT framework and the broader GATS-native proprietary capital doctrine. His work focuses on sovereign capital governance, algorithmic trading architecture, reserve-first compounding systems, and institutional financial engineering within closed proprietary environments.
Business Model Clarification
Global Financial Engineering, Inc. and Global Accountancy Institute, Inc. operate as closed-loop proprietary institutions. They do not offer public investment products through the doctrines described herein, do not invite retail participation into their proprietary capital architecture, and do not present the GCPIAUT framework as a public collective investment scheme. The concepts discussed in this article are part of the firms’ internal intellectual and operating doctrine.
Risk Disclaimer
Trading and investment activity across foreign exchange, equities, futures, commodities, and digital assets involves substantial risk. Market conditions may change rapidly, and losses may occur. This article is provided for intellectual, institutional, and educational discussion only and does not constitute investment advice, an offer, a solicitation, or a recommendation to buy or sell any financial instrument or to participate in any investment structure.